Previous Step
Order of Operations
Click here to view this diagram in a new tab
- Add an additional interface to the pfSense VM
- This interface will serve as the target for all of the SPAN configurations
- The SPAN configurations will create copies of each Ethernet frame from each interface and send them to the SPAN port
- Install the Wazuh Stack as an all-in-one installation
- Use the quick setup script to install the following services:
- Wazuh Indexer
- Wazuh Manager
- Wazuh Dashboard
- Install the NIDS component on the same VM
- Suricata will capture packets from the SPAN interface
- It will output logs in JSON format, which will be read by Wazuh Manager
- As your lab grows, install Wazuh Agents on your Linux and Windows VMs
- Install agents on any hosts you want to monitor
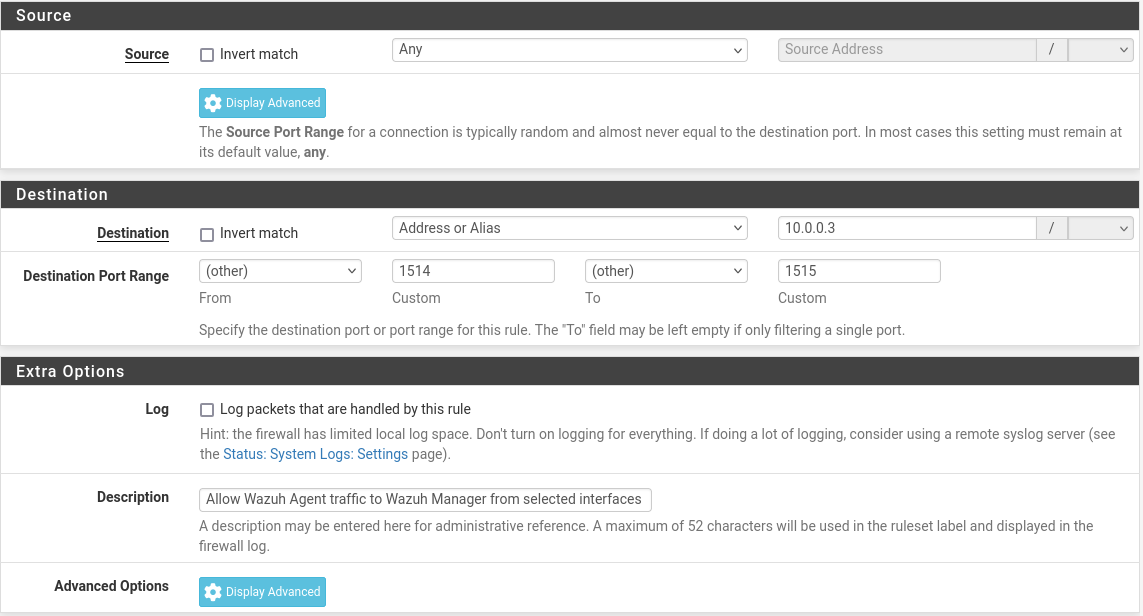
- The hosts need to be able to communicate with the Wazuh Manager's IP address over
tcp/1514andtcp/1515(can also be configured for UDP if desired)
Desired End State
pfSense VM
- New interface added and SPAN configurations created
Wazuh Stack + NIDS
- Configured network interfaces
- Installed and configured Wazuh Stack
- Log into Wazuh Dashboards
- Ensure all connections are working
- Installed and configured Suricata
- Capturing packets from SPAN
- Wazuh Manager is configured to read Suricata logs
Wazuh Agents
- Wazuh Agent is installed on any host to be monitored
- Wazuh Agent can communicate with Wazuh Manager IP over
tcp/1514andtcp/1515
Enabling Packet Capture
pfSense SPAN Port
Overview of the Changes
In this step, we are going to add an additional interface to the pfSense VM, much like we did in the previous step, but in the case of this new interface, it will serve the sole purpose of being a SPAN port to capture packets.
Click here to view this diagram in a new tab
In the case of this diagram, we are doing the following:
- Adding a new interface to the pfSense VM called, SPAN
- Attaching the SIEM / IDS to the LAN and SPAN interfaces
- The LAN interface provides a DHCP address to the SIEM
- The SPAN interface does not get any IP assignment and is simply used to receive frames copied from each interface, which in this case is:
- LAN
- ISOLATED
- AD_LAB
- SEC_EGRESS
- The SPAN interface does not get any IP assignment and is simply used to receive frames copied from each interface, which in this case is:
- With the Ethernet frames flowing to the SPAN interface
- Suricata on the IDS host will analyze the packets and generate logs
- Wazuh will be configured to ingest the log file(s)
Adding the SPAN Port
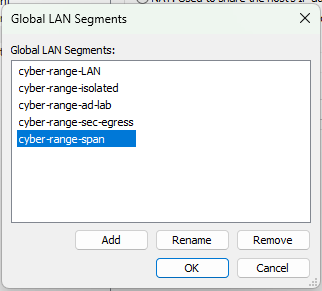
cyber-range-span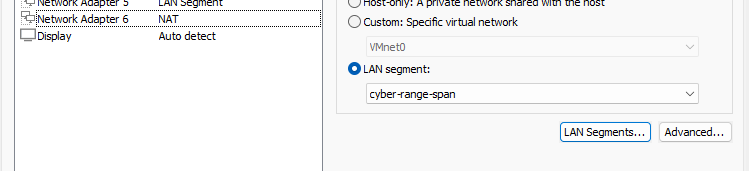
cyber-range-spanConfigure the New Interface

em5 is now available
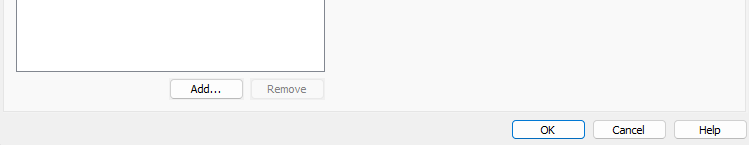
+ Add button. Then, click on OPT4.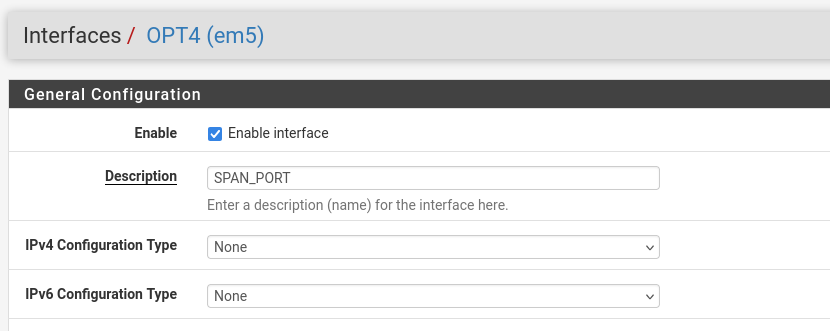
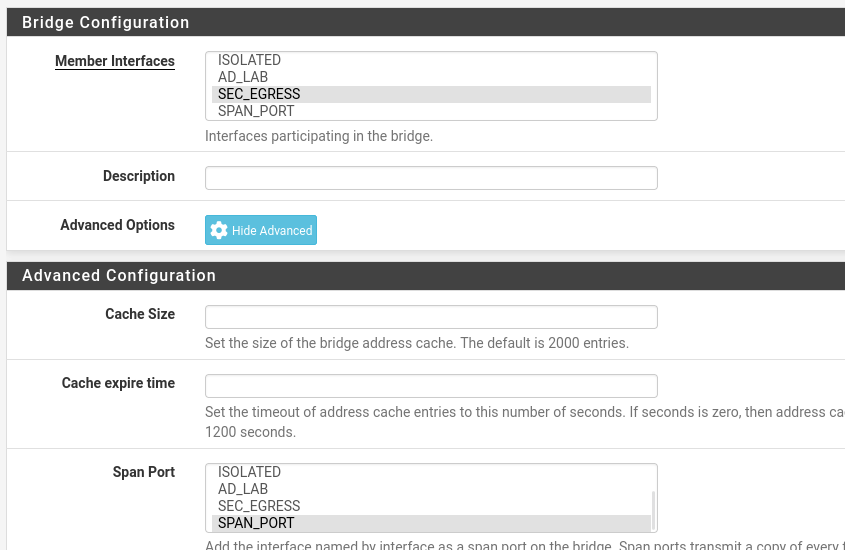
Configure the Span Ports
Also, moving forward, if you add any additional subnets to your pfSense cyber range, you'll need to repeat this procedure for the traffic to be captured by the NIDS.
LAN to SPAN
+ Add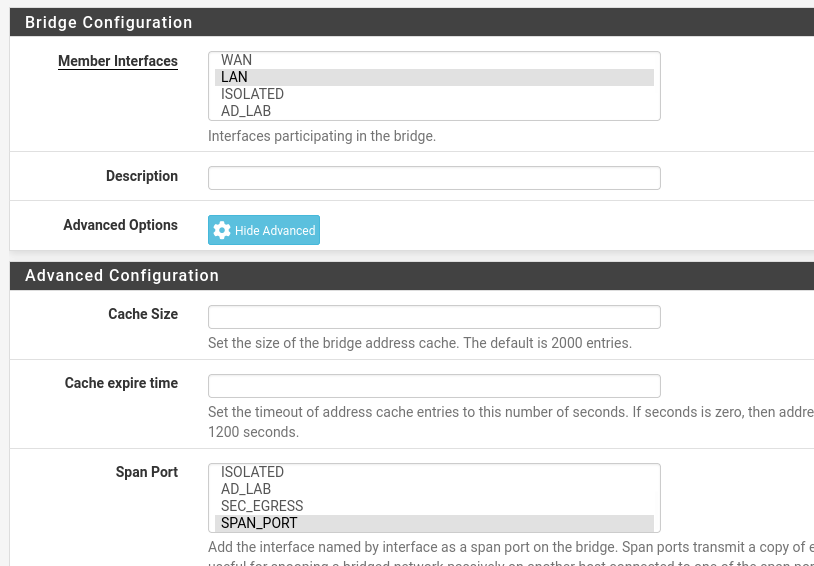
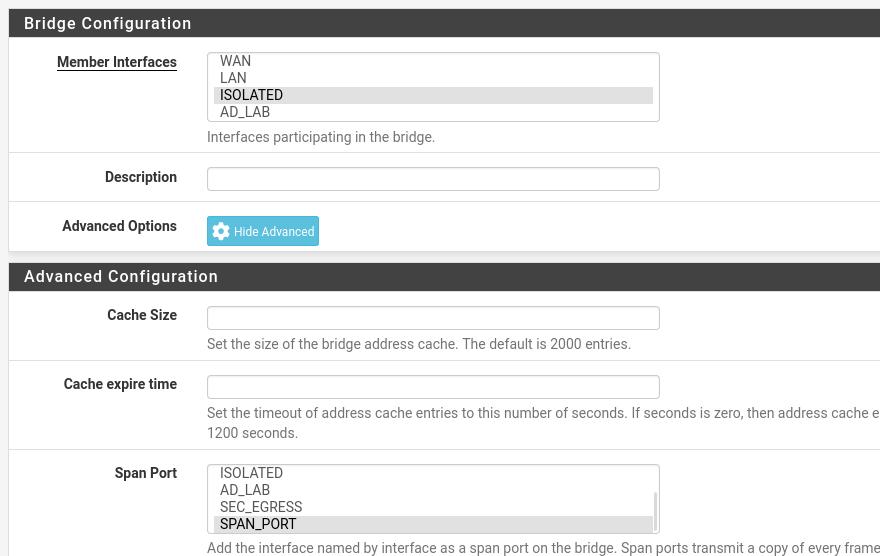
ISOLATED to SPAN
AD_LAB to SPAN
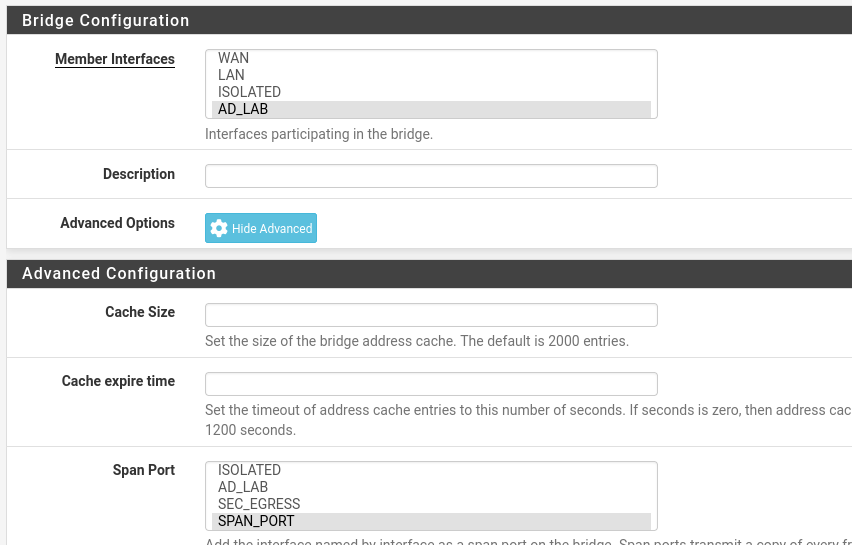
SEC_EGRESS to SPAN
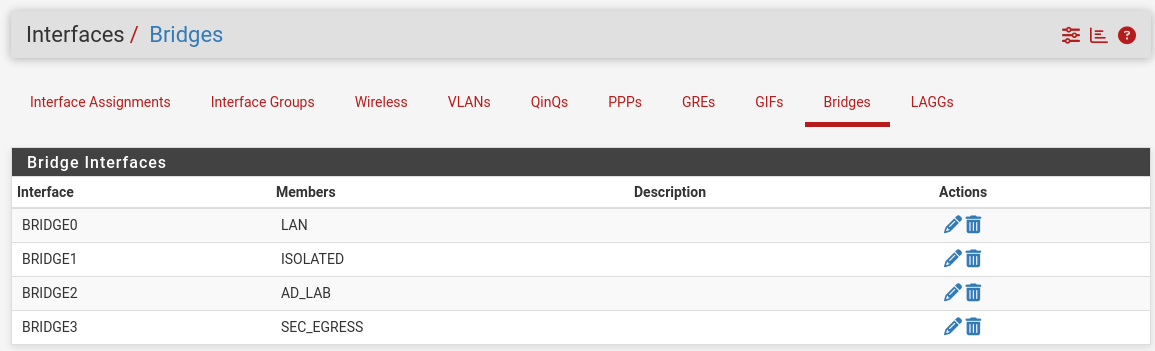
Desired End State
Adding the Wazuh Stack
Ubuntu Server OVA
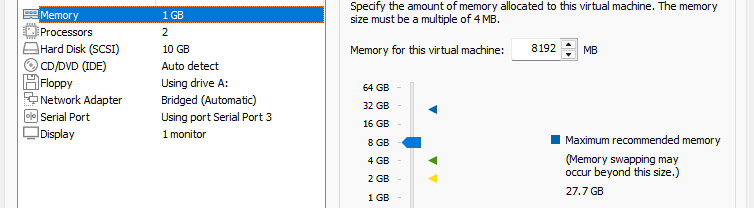
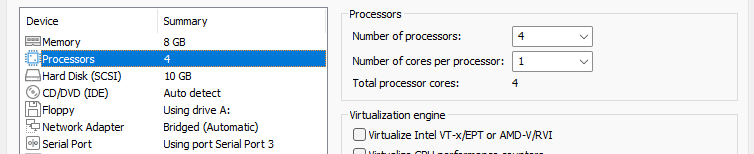
We are going to use the same specs that would be configured with the Wazuh OVA appliance:
- 4 CPU
- 8 GB RAM
- 50 GB Disk
Import the OVA
Ubuntu Noble Numbat is the current LTS image as of this writing

.ova file, which is ready-made for VMware (and VirtualBox)
.ova file and begin the import procedure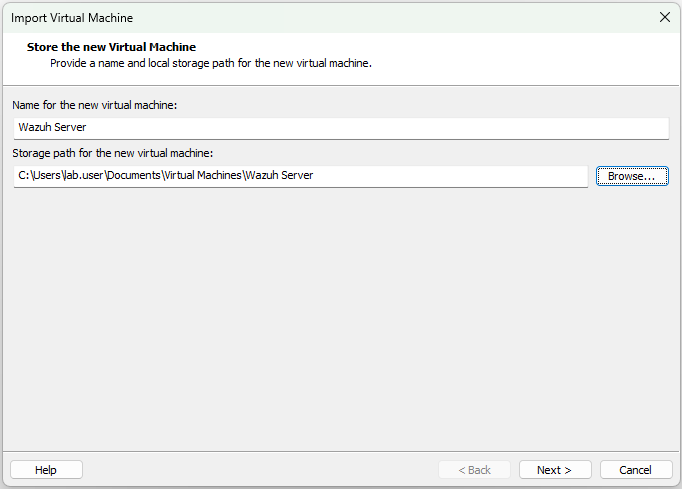
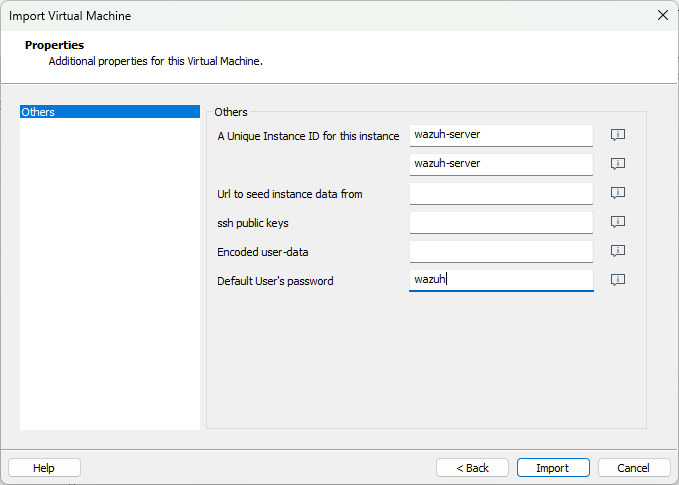
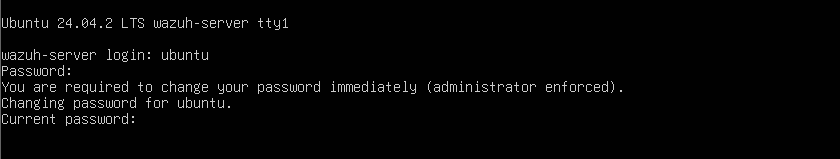
- Username:
ubuntu - Password:
wazuh— or whatever you assigned in the window above
sudo poweroffPower off the VM for additional configuration
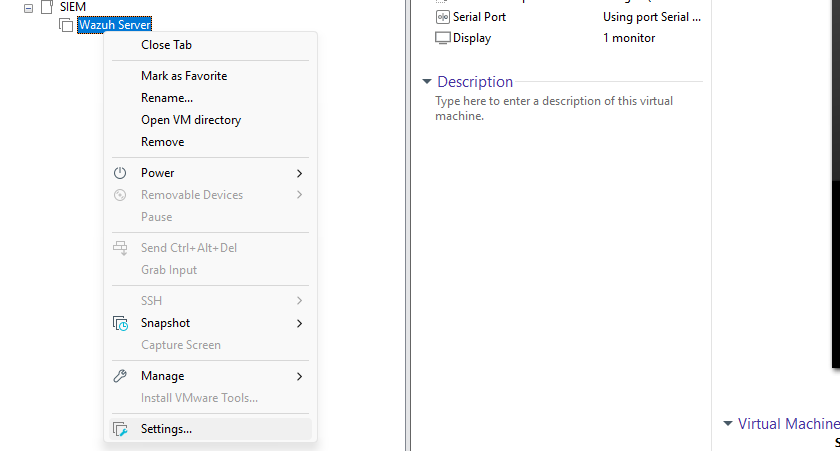
Configure the VM
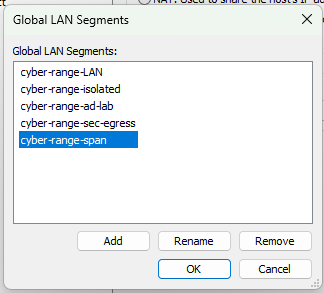
cyber-range-span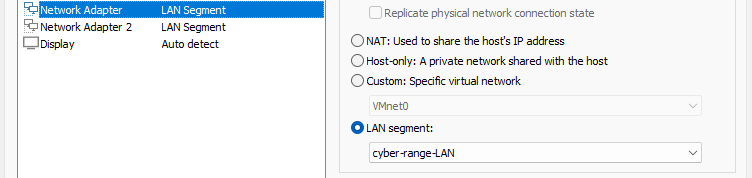
cyber-range-LAN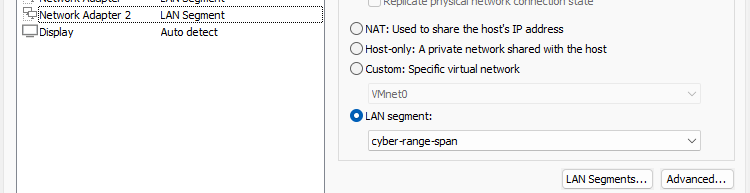
cyber-range-spanAdd a DHCP Reservation
Log into pfSense using your Kali VM and go to Status > DHCP Leases...

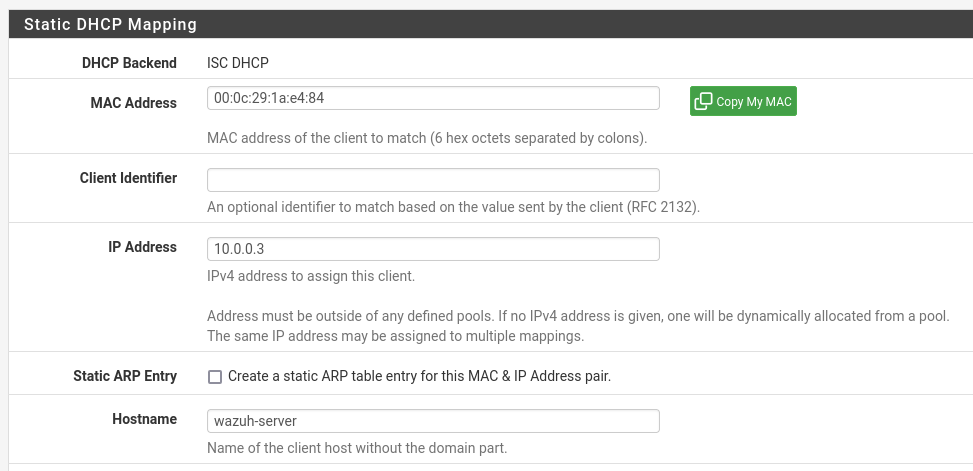
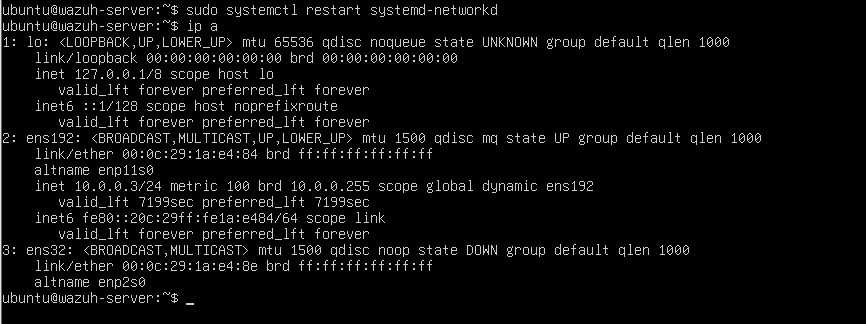
10.0.0.3 > Click Save and Apply Changessudo systemctl restart systemd-networkdRun this command on Wazuh Server to restart the network stack and pull a new DHCP lease
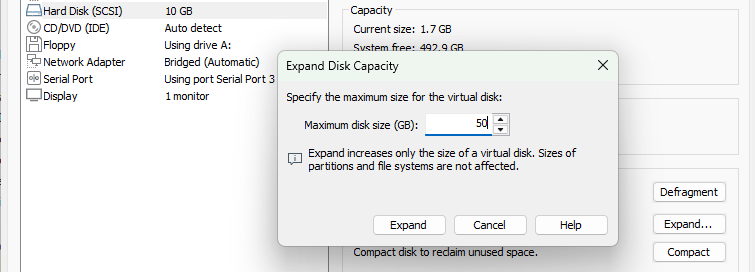
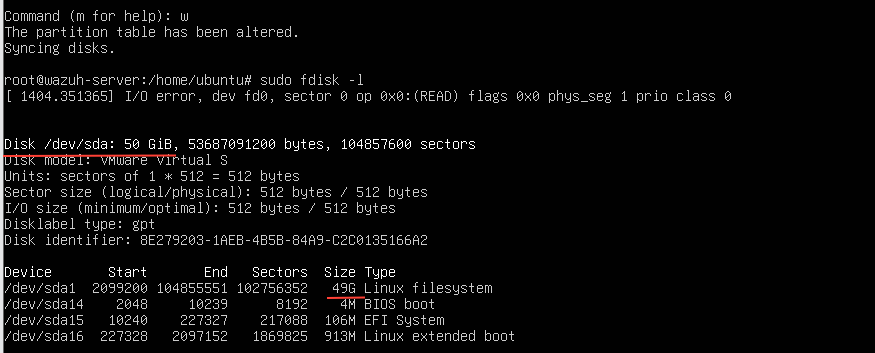
Expanding the Disk Partition
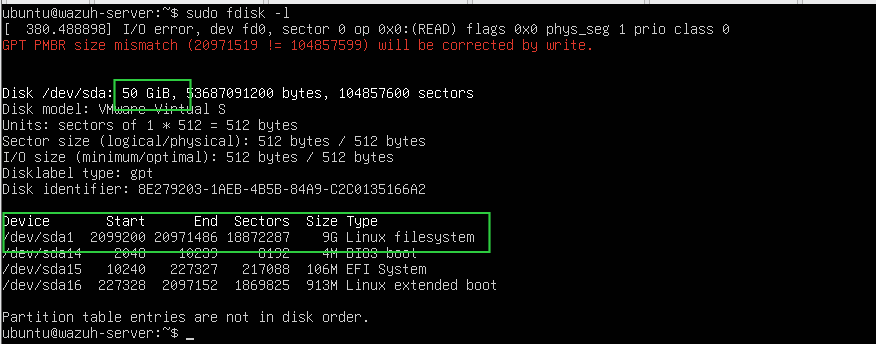
sudo fdisk -l output shows the disk is 50 GiB but the file system is 9G
sudo fdisk /dev/sdacommand (m for help): FInput F to list free sectors
command (m for help): dEnter 1 to delete the first partition, which is the one want to resize
command (m for help): nEnter 1 to create partition one
- First Sector: Press the
ENTERkey to accept the default - Last Sector: Press
ENTERkey to accept the default - Do you want to remove the signaure? Enter
N
command (m for help): wEnter w to wr
sudo resize2fs /dev/sda1Resize the partition
sudo reboot
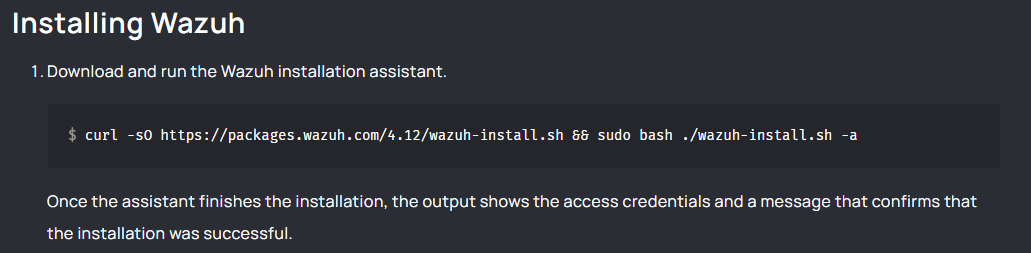
df -h / now shows the correct sizeInstalling the Wazuh Stack

Since this is a lab environment, we'll just use the all-in-one installation
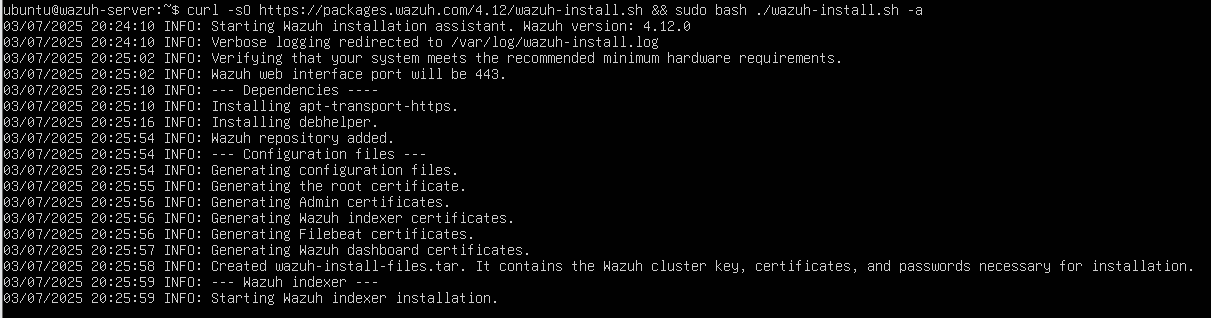
When the installation completes, you should see the password for the admin user printed to the console. However, this VM doesn't support copying to clipboard, so I'm going to use the wazuh-passwords-tool.sh utility to change to something a little easier to type.
sudo /usr/share/wazuh-indexer/plugins/opensearch-security/tools/wazuh-passwords-tool.sh -u admin -p 'P@$$word123!'Change P@$$word123! to a new password of your choice
sudo filebeat keystore add passwordUpdate filebeat with your new admin password
sudo systemctl restart filebeatRestart the filebeat service to use the new password
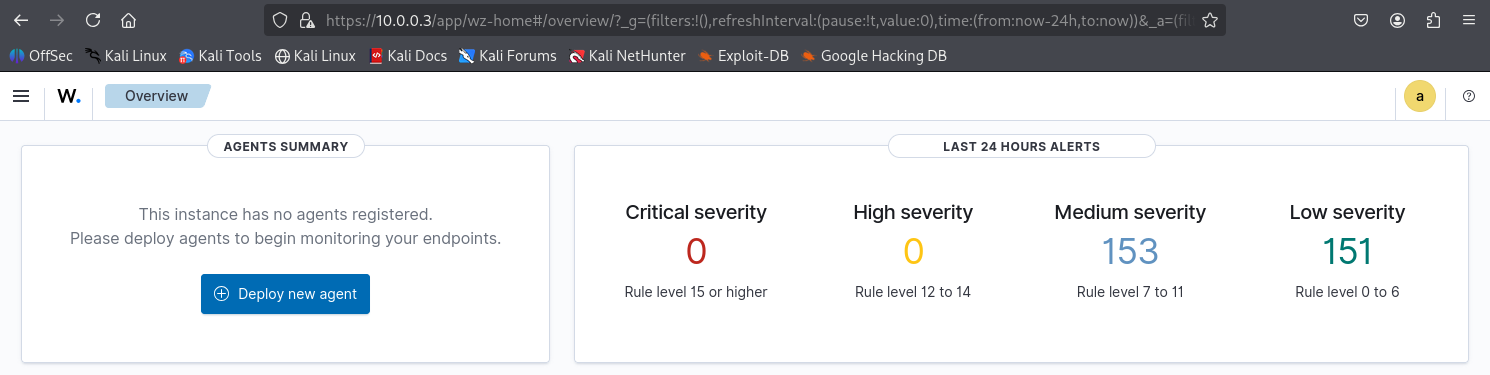
Logging into Wazuh Dashboard

https://10.0.0.3. Ignore any certificate / TLS warnings, as the service is using a self-signed certificate on the web server.The login for the Wazuh Dashboard server is:
- Username:
admin - Password: changed using the
wazuh-passwords-tool.shutility
Install the NIDS
Auto-Raise Capture Interface
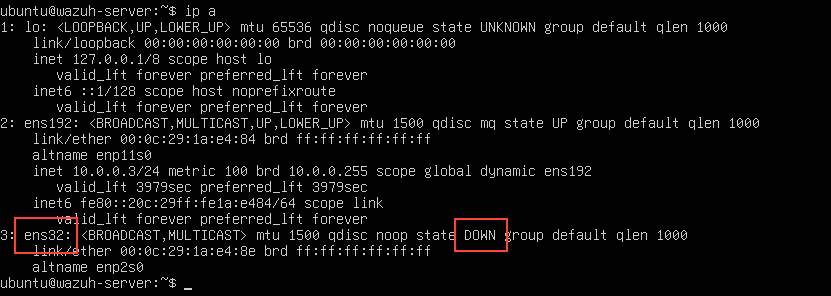
netplan to bring this interface up at boot.sudo nano /etc/netplan/50-cloud-init.yamlnetwork:
version: 2
ethernets:
ens192:
match:
macaddress: "00:0c:29:1a:e4:84"
dhcp4: true
dhcp6: true
set-name: "ens192"Before
network:
  version: 2
  ethernets:
    ens192:
      match:
        macaddress: "00:0c:29:1a:e4:84"
      dhcp4: true
      dhcp6: true
      set-name: "ens192"
ens32:
dhcp4: false
dhcp6: false
optional: trueAfter (adds ens32)
sudo netplan apply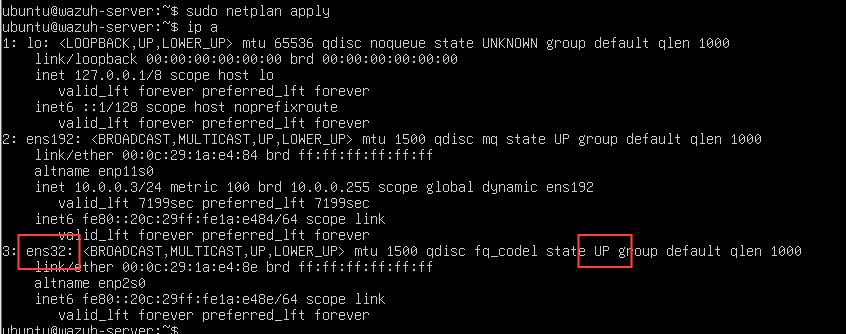
Packet Capture Test
In the screenshot below, I'm using tcpdump to listen on ens32 for packets coming from or going to 10.0.0.2 — which is Kali's IP address.
- On the right, we can see Kali pinging
1.1.1.1 - On the left, we can see the traffic in the packet capture
Kali sends
ping requests to 1.1.1.1, which flows up the wire to pfSense, where the bridge0 interface we setup before copies each frame to the SPAN port listening on ens32.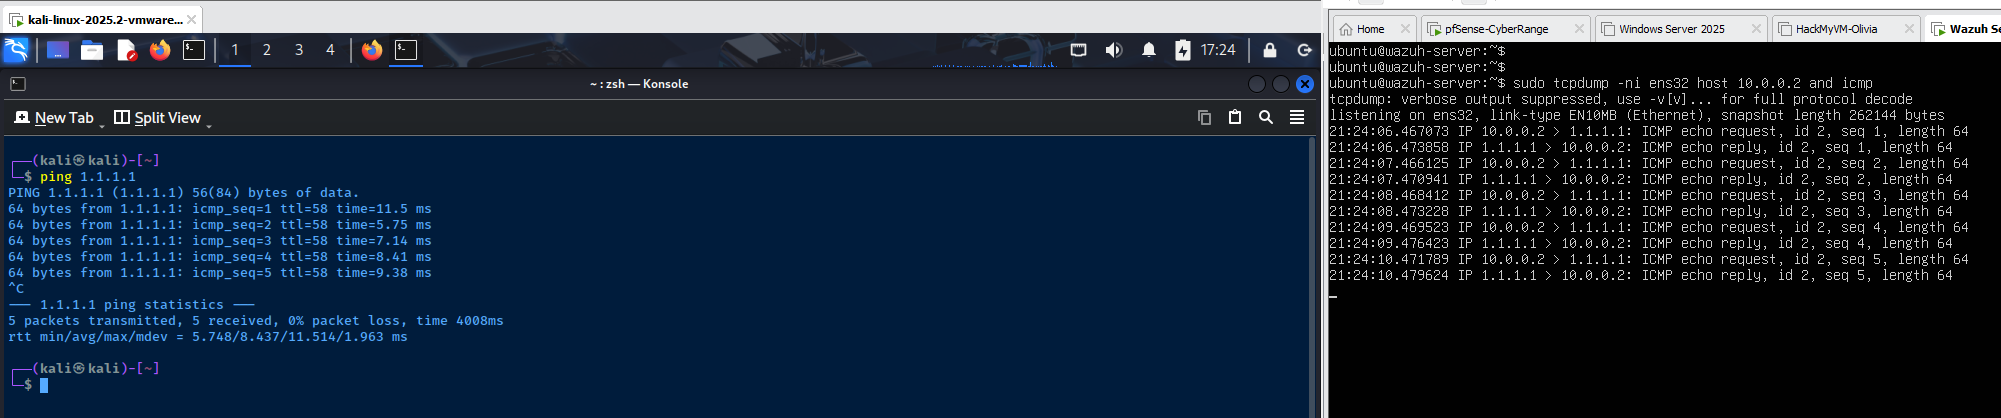
Install and Configure Suricata
sudo apt install -y suricatasudo nano /etc/suricata/suricata.yamlsuricata.yaml file is large and contains lots of nested configurations. I'm only going to highlight here any required changes to the file. # Extensible Event Format (nicknamed EVE) event log in JSON format
- eve-log:
enabled: yes
filetype: regular #regular|syslog|unix_dgram|unix_stream|redis
filename: eve.jsonenabled: yes should be set by default, but we want to log in JSON format
# Linux high speed capture support
af-packet:
  - interface: ens32
    # Number of receive threads. "auto" uses the number of cores
    #threads: auto
    # Default clusterid. AF_PACKET will load balance packets based on flow.
    cluster-id: 99
    # Default AF_PACKET cluster type. AF_PACKET can load balance per flow or per hash.
    # This is only supported for Linux kernel > 3.1
...
...
...
Set to - interface: ens32 in order to capture packets on the correct interface
CTRL + x and then y to save changes to the suricata.yaml fileSelect Suricata Rule Sources
sudo suricata-update update-sourcessudo suricata-update list-sources --freeList Suricata rule sources that do not require a key / token / license
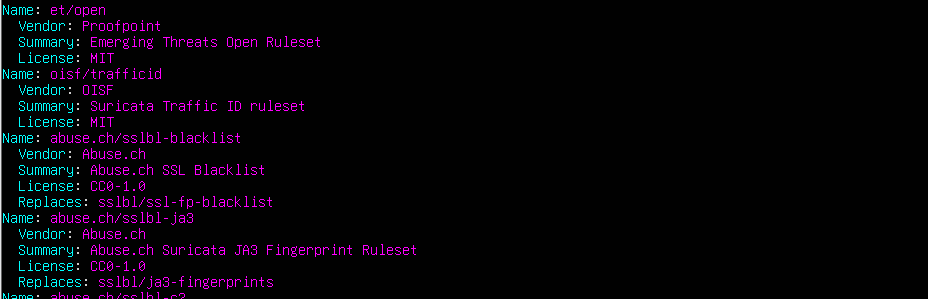
sudo suricata-update enable-source et/openEnable the et/open source
sudo suricata-update enable-source tgreen/huntingsudo suricata-update enable-source stamus/lateralsudo suricata-update enable-source aleksibovellan/nmapsudo suricata-updateRun this command to pull the latest rulesets
sudo crontab -eEdit the root user's crontab
@reboot /usr/bin/suricata-update
0 2 * * * /usr/bin/suricata-update
Update Suricata rulesets every day at 2 AM and any time the system boots
sudo systemctl enable --now suricatasystemctl status suricata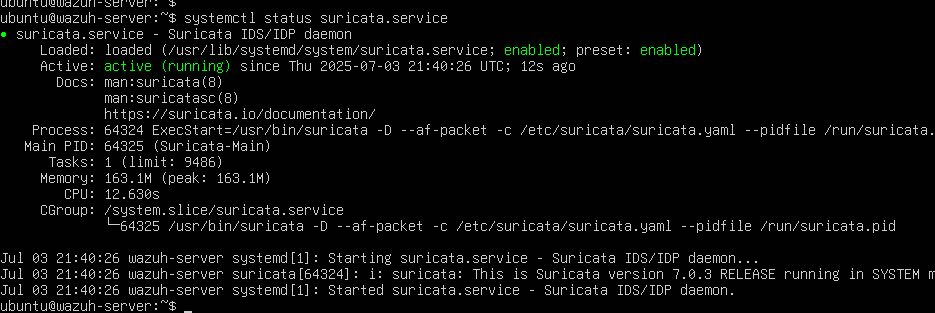
sudo top or sudo htop and if needed, add more CPU and RAM to the box.Configure Wazuh Manager
Now that Suricata is analyzing captured network traffic, any events will be written to /var/log/suricata/eve.json. We need to tell the Wazuh Manager to read and ingest the logs from the file.
sudo nano /var/ossec/etc/ossec.confossec.conf file is quite large<ossec_config>
<global>
<rotate_interval>1d</rotate_interval>Add the <rotate_interval></rotate_interval> frequency in the global section. This configuration rotates logs daily.
<ossec_config>
  <localfile>
    <log_format>json</log_format>
    <location>/var/log/suricata/eve.json</location>
  </localfile>
</ossec_config>
Add this ENTIRE block to the BOTTOM of the file
sudo systemctl restart wazuh-managerRestart the Wazuh Manager service to implement the changes
Trim Logs
sudo crontab -e# Run every day at 0400
# Find Suricata log files older than 30 days and delete
0 4 * * * find /var/log/suricata -maxdepth 1 -mtime +30 -type f -exec rm -f {} \; > /dev/null
# Run every day at 0400
# Find Wazuh log directories older than 30 days and recursively delete
0 4 * * * find /var/ossec/logs/alerts -type d -mtime +30 -exec rm -rf {} \; > /dev/null 2>&1
0 4 * * * find /var/ossec/logs/archives -type d -mtime +30 -exec rm -rf {} \; > /dev/null 2>&1Add these entries to root crontab below the one previously created
Prevent Unplanned Upgrades

Link to Wazuh official documentation
When consulting the Wazuh official documentation, you should take note of one key requirement:
We want to avoid unplanned upgrades of the Wazuh Manager stack and the Wazuh agents. So, first we'll take care of this on the Wazuh Manager side.
sudo apt-mark hold wazuh-indexersudo apt-mark hold wazuh-dashboardsudo apt-mark hold wazuh-managerapt. However, the latest package can still be installed by running sudo apt install -y wazuh-indexer, etc. In that case, you need to re-run sudo apt-mark hold wazuh-indexer, etc again, depending on what was installed.Installing the Wazuh Agent
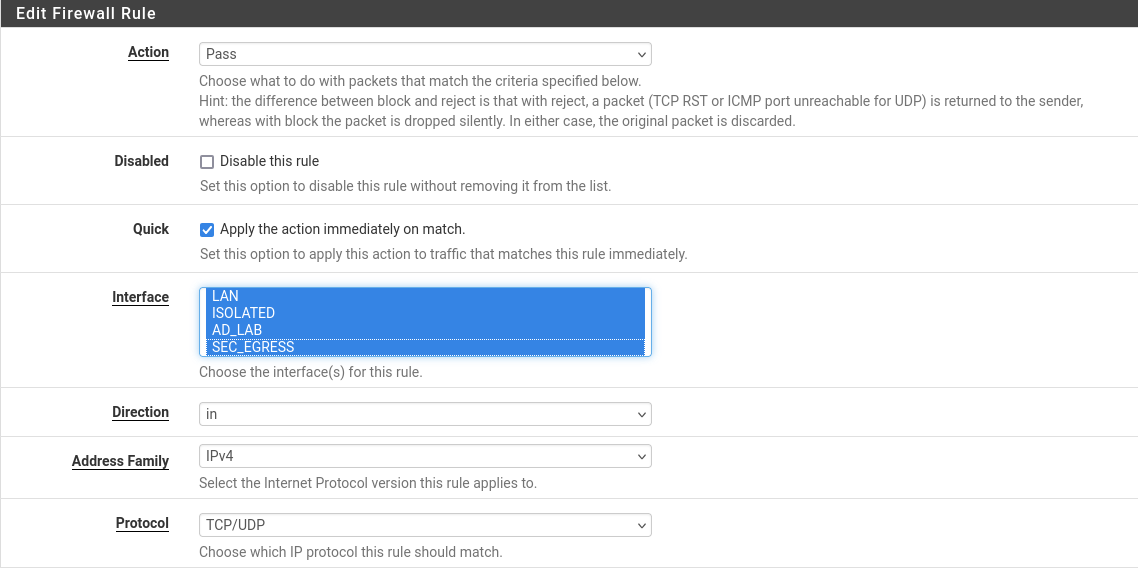
Update pfSense Firewall Rules
Log into the pfSense web configuration console and navigate to Firewall > Rules > Floating.

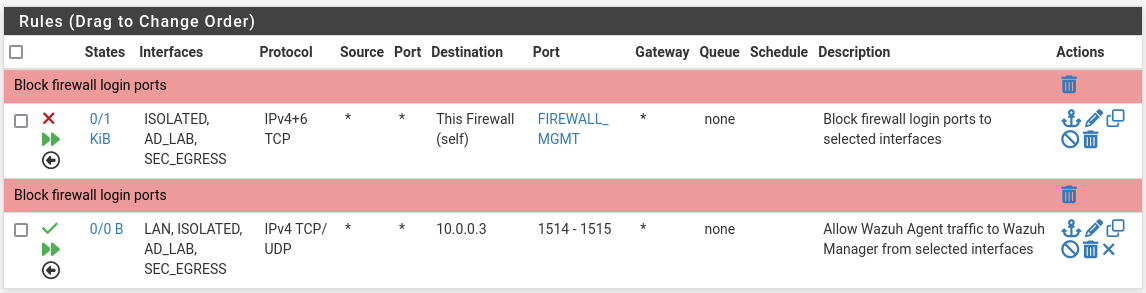
Example: Installing on Windows
In this example, I'm going to install the Wazuh Agent on a Windows Server 2019 host (the domain controller in my AD_LAB LAN).

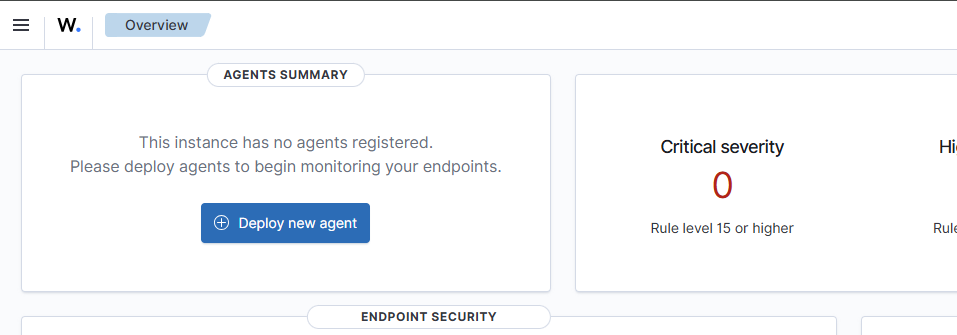
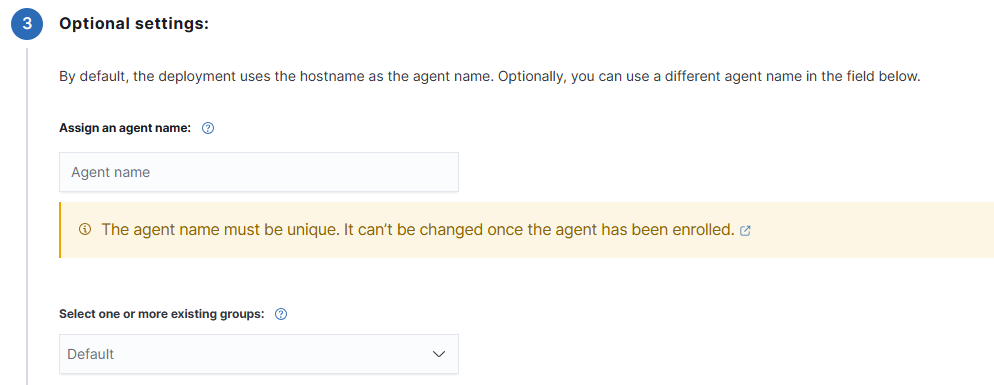
+ Deploy new agent button in the Wazuh Manager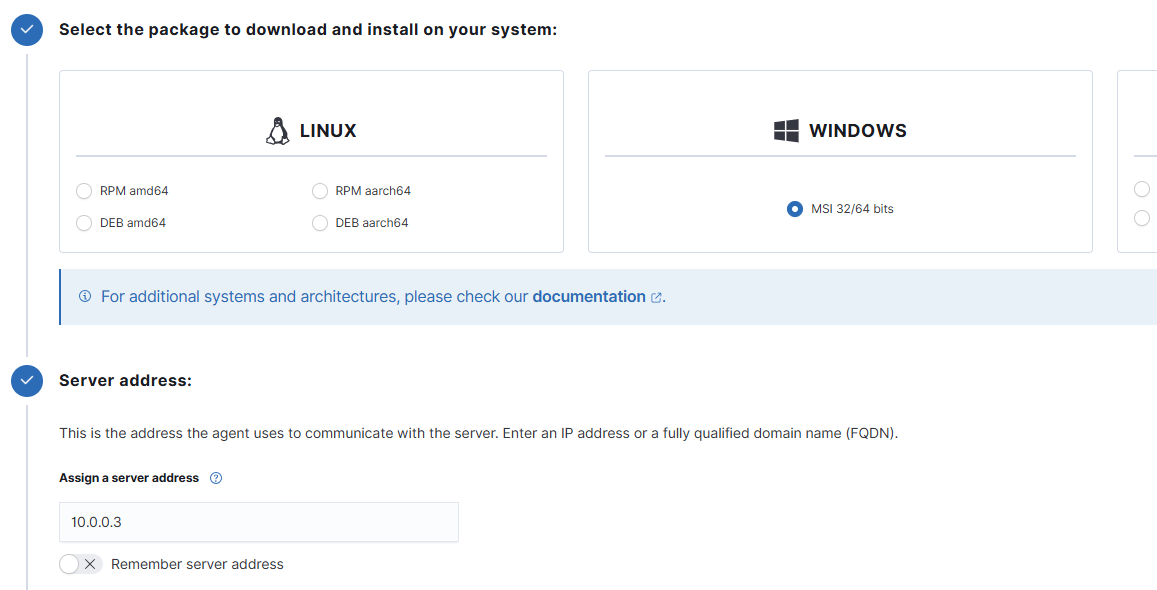
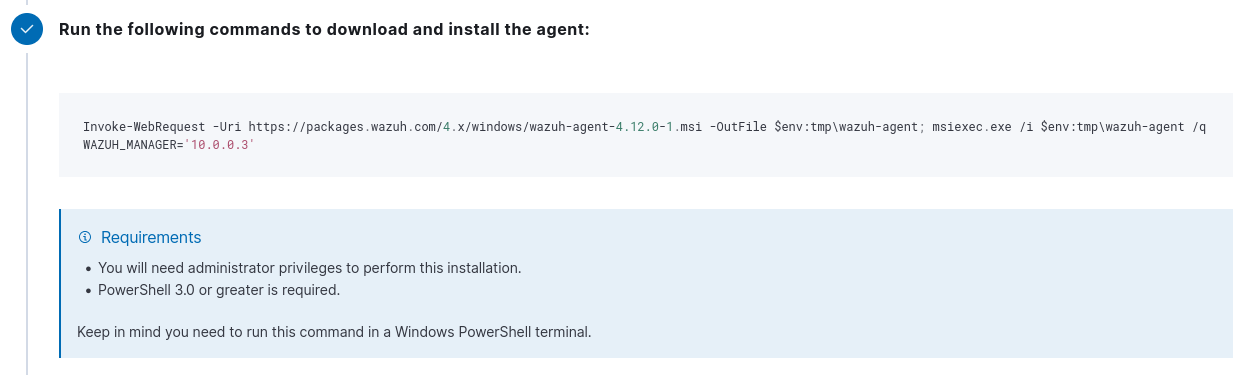
When copying the command, paste into a text editor such as notepad.exe on your Windows host. Then copy from notepad.exe and paste into the Windows VM. You may also need to install open-vm-tools on your Windows VM to enable clipboard access.
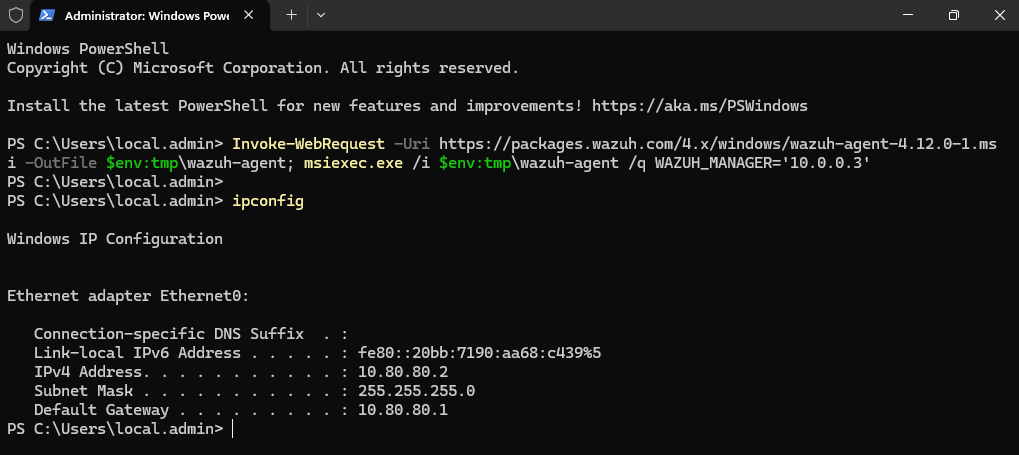
Get-Service WazuhSvcCheck if the service was installed
Get-Service WazuhSvc | Start-ServiceOnce installed, start the service
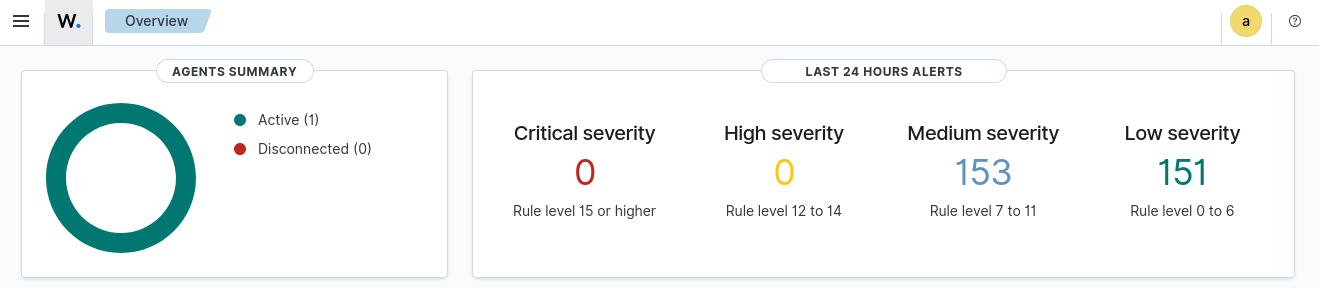
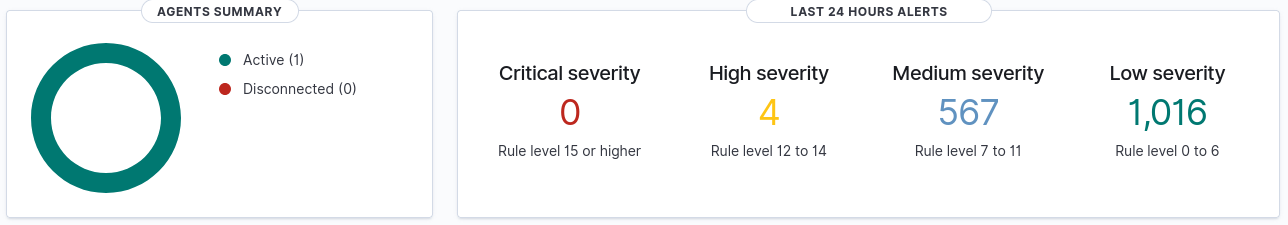
1 active agent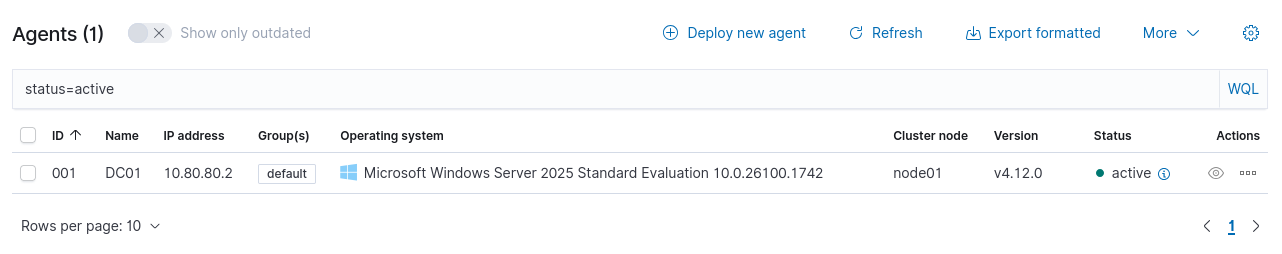
Integrate Sysmon
This is a great way to extend the monitoring capabilities on your Windows hosts. In this article, I show you how to:
- Download the Sysmon ruleset for Wazuh Manager
- Install Sysmon on Windows hosts
- Create a Wazuh Agent group and add Windows hosts to the group
- And ingest the Sysmon logs from your Windows endpoints using the Wazuh Agent
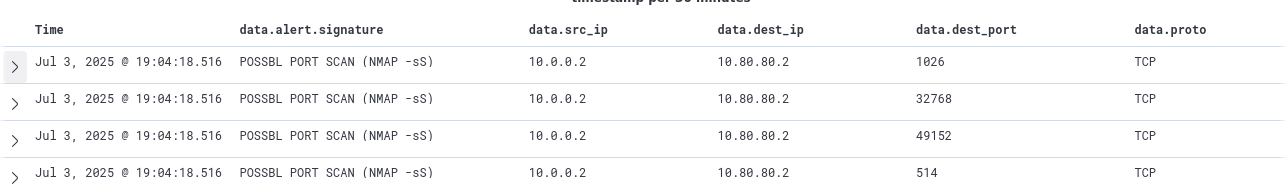
Testing Capabilities
I am running the example commands on my Kali VM and targeting my domain controller at 10.80.80.2. The credentials I'm using come from the AD lab exercises in the previous parts of this home lab series.
impacket-secretsdump -outputfile 'dcsync.txt' 'ad.lab/Administrator:P@$$word123!'@10.80.80.2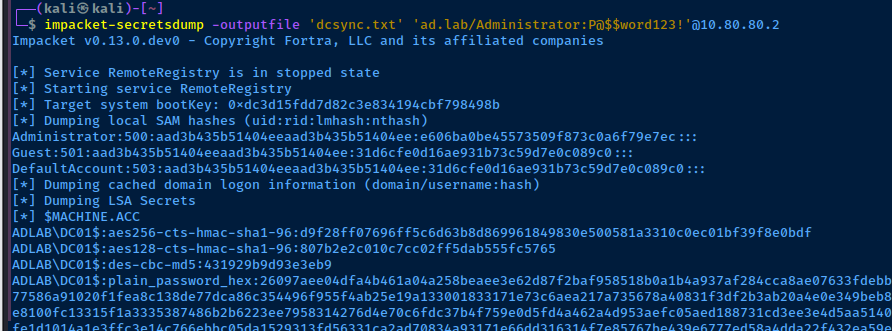
impacket-psexec 'ad.lab/Administrator:P@$$word123!'@10.80.80.2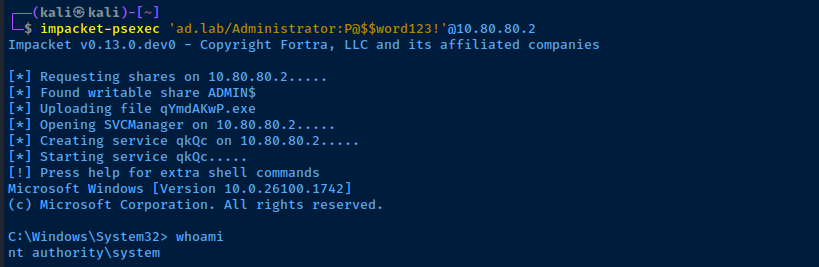
psexec.py on the domain controllersudo nmap -Pn --top-port 50 10.80.80.2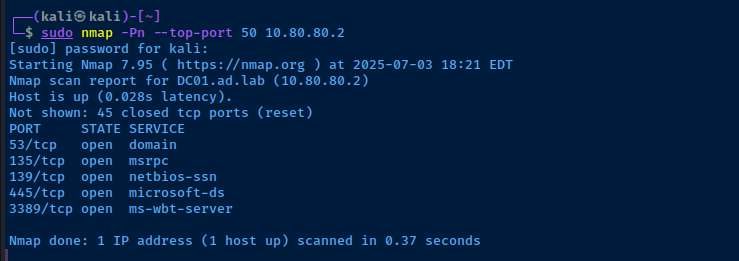


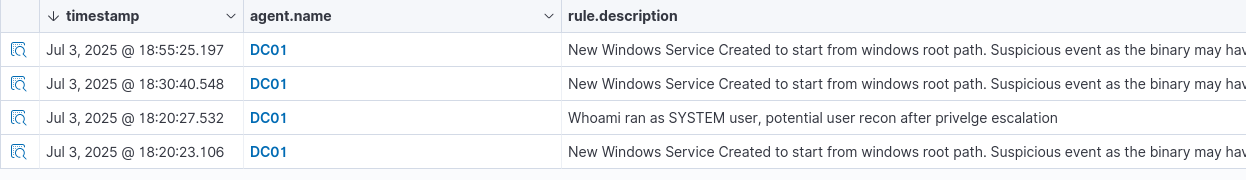
psexec.py service including running whoami as SYSTEM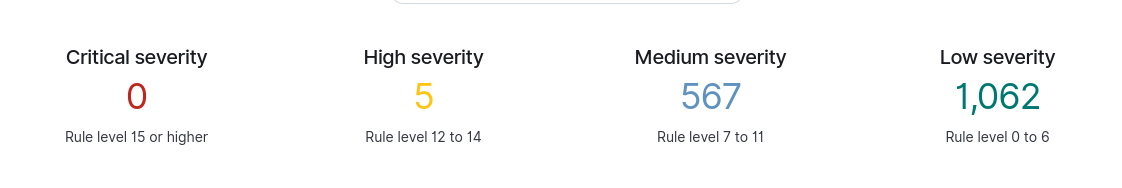
Important: Index Management
You REALLY want to do this now as opposed to later.
- Save your disk space
- Reduce stressful troubleshooting hours
- Trim your indices and improve performance
Do it now! Please.
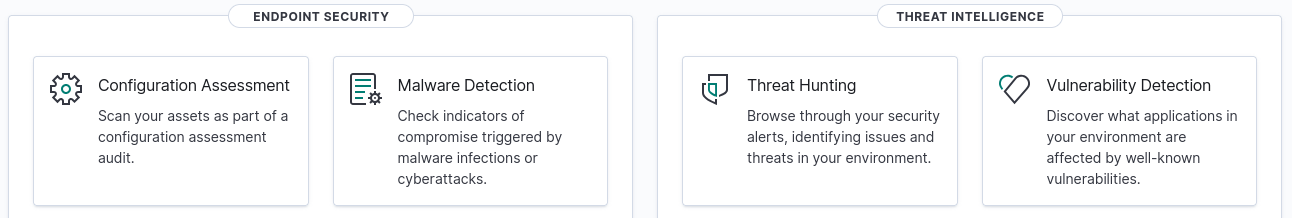
Follow-Up Activities
Extending Wazuh's Capabilities
Taylor Walton has done a really fantastic job at creating content that showcases Wazuh's capabilities and ways to extend it with various integrations. I wholeheartedly recommend taking a look.

Also, have a look at a some of the additional Wazuh content I've written. If I included, everything here, the guide would quickly grow out of scope.
Finishing Up the Home Lab Guide

Click here to be taken to the project appendices and view other projects