Previous Step
Reviewing Some Networking Concepts
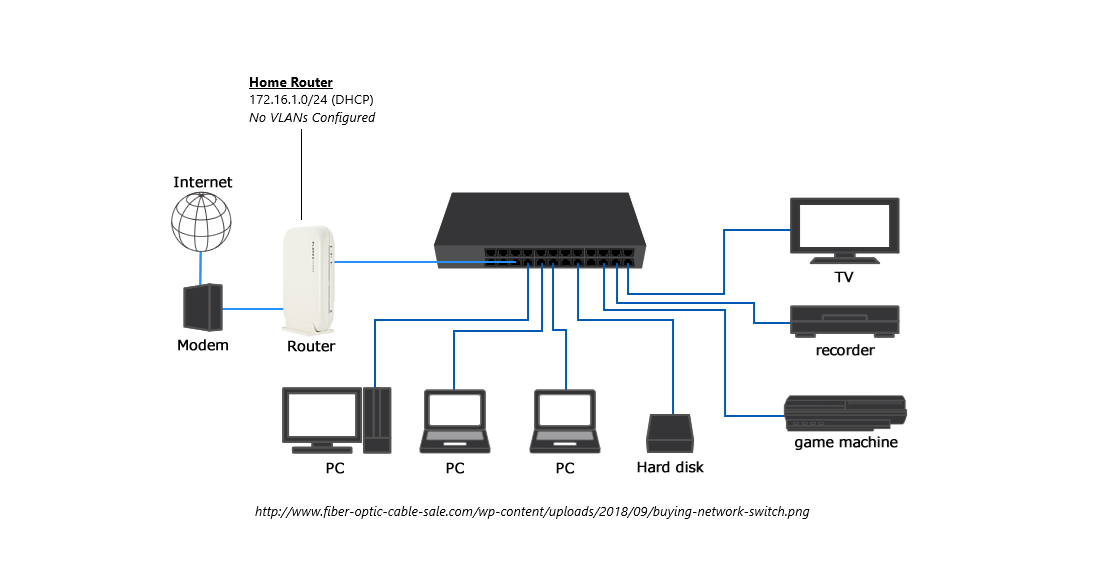
Router and Switch with Default Configurations
In this scenario, there is a router with a very simple, default configuration. The router has the default private IP address range of 172.16.1.0/24. The DHCP server is enabled and no VLANs are configured.
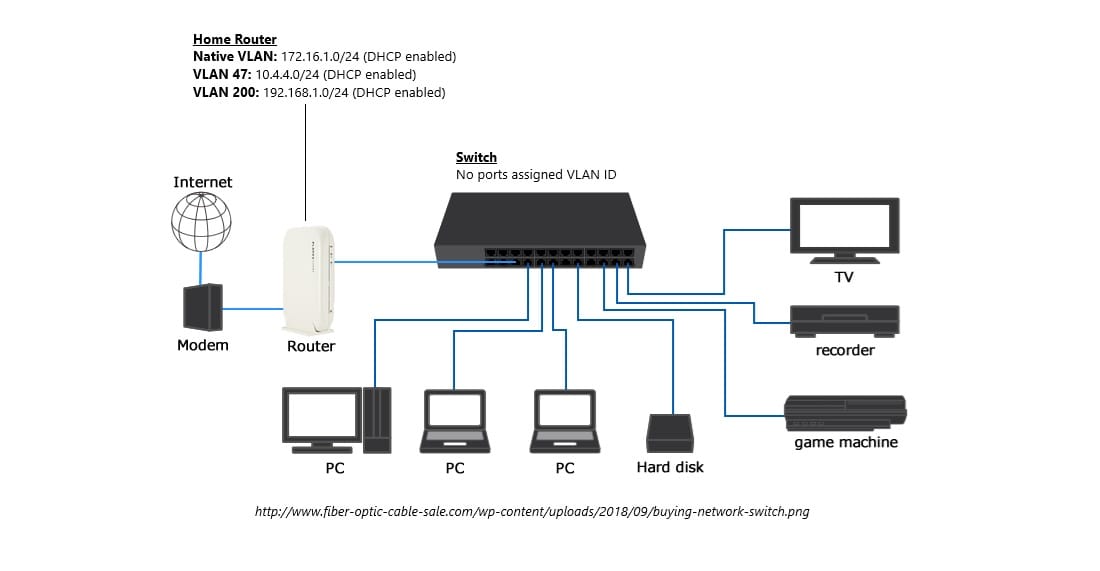
Router with VLANs Configured, Default Switch Configurations
In this scenario, we have configured some VLANs in the router. That way, the router and switch can work harmoniously to route packets if it receives an Ethernet frame that was tagged with a VLAN ID. However, none of the switch ports have been configured with VLAN ID tags.
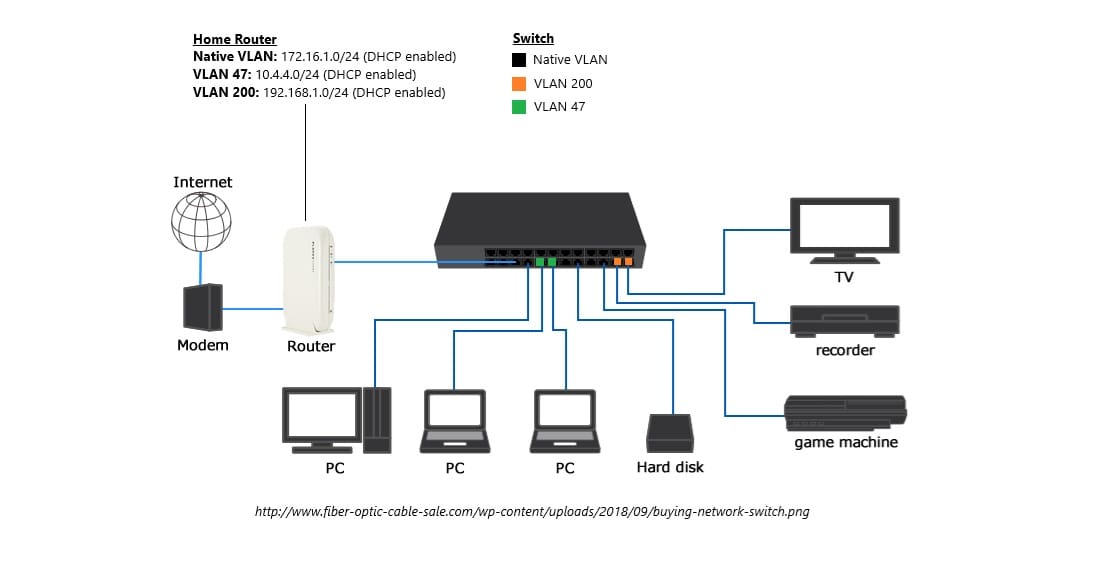
Router with VLANs and Configured Switch Ports
In this scenario, the switch tags the Ethernet frames with a VLAN tag for any configured switch ports. That way if an Ethernet frame contains a VLAN ID tag, the switch checks configured ports for the correct VLAN ID and MAC address.
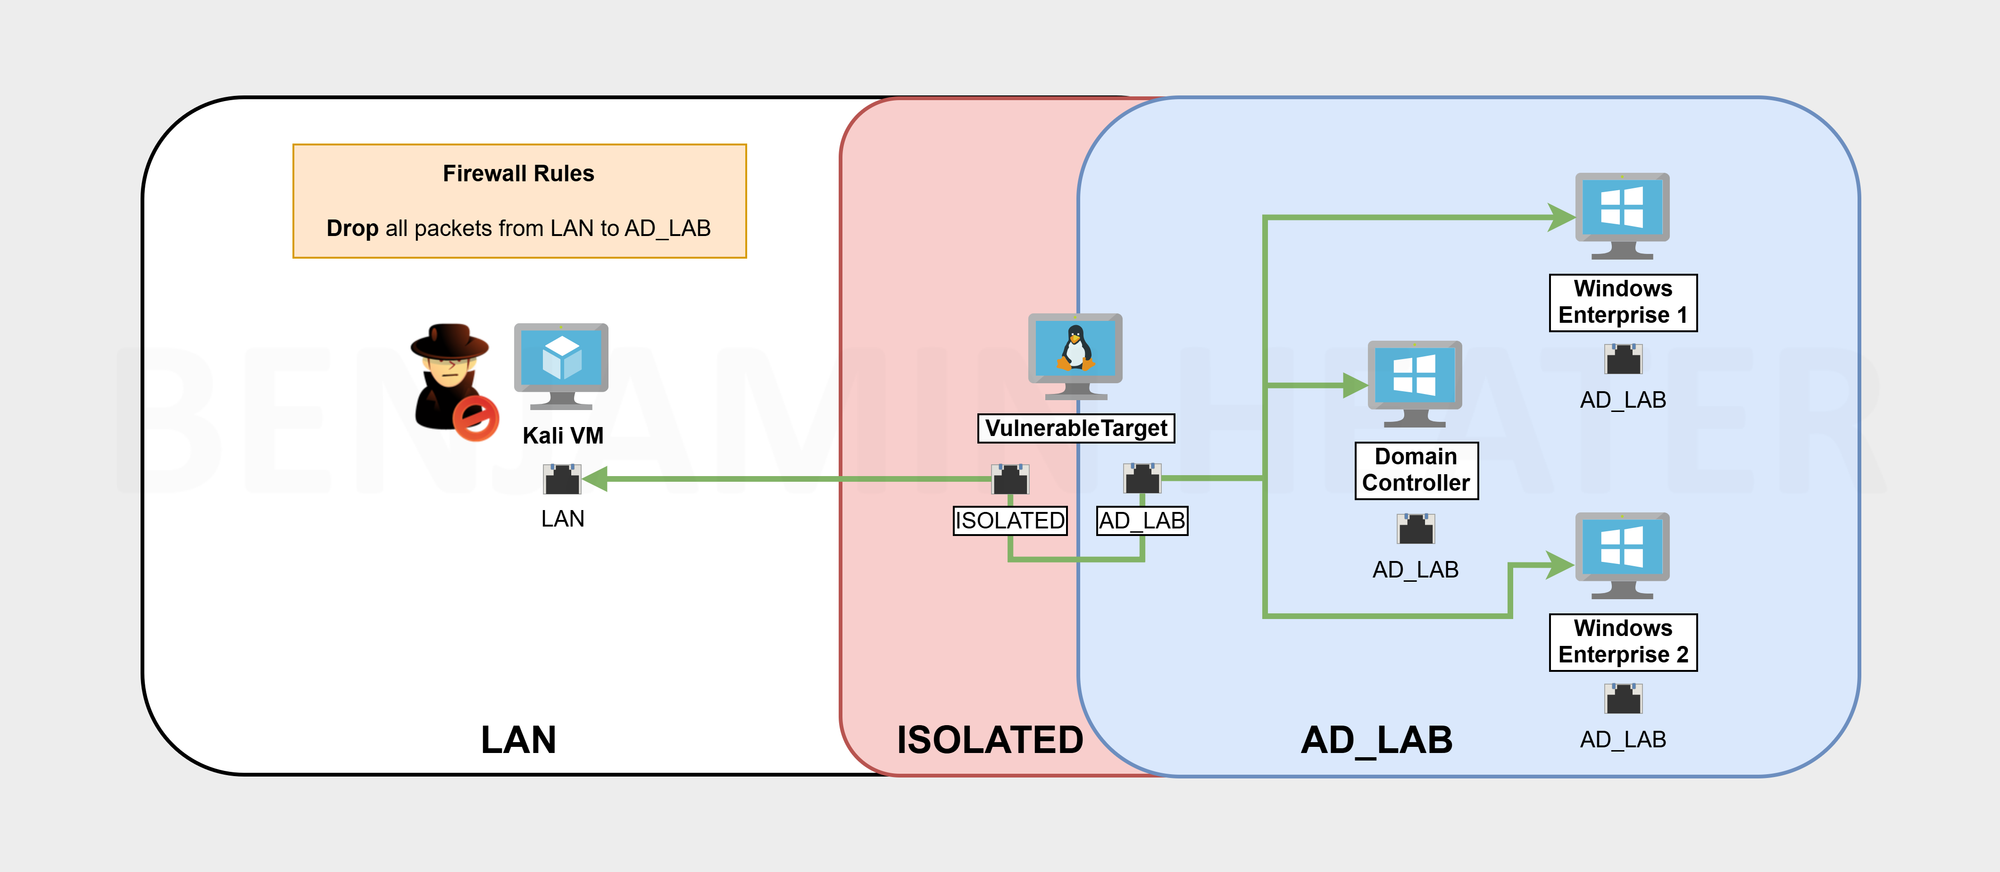
Router with VLANs, Tagged Switched Ports, and Port Mirroring
Port mirroring is where we configure a switch to send a copy of every Ethernet frame to another port on the switch. This is a common configuration with Intrusion Detection Systems when you want to monitor all traffic on a network.

Understanding the Proxmox Networking
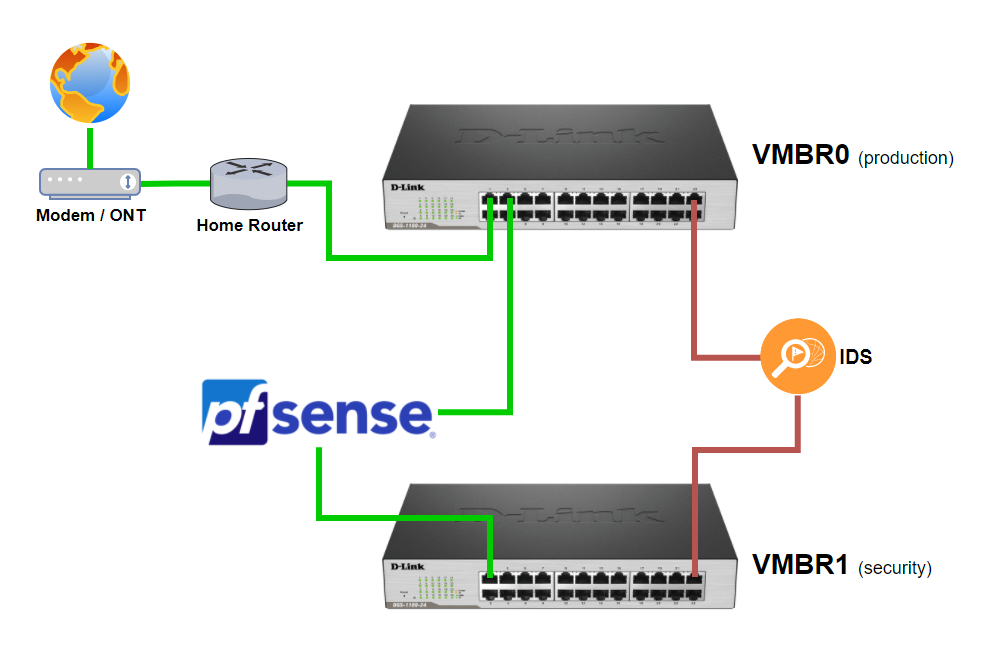
VMBR0is the switch where all of your VMs and containers connected to your home network will be.- If you have a home router that supports
802.1q, then you could apply some VLAN segmentation toVMBR0divide your VMs and containers into further subnets if desired
- If you have a home router that supports
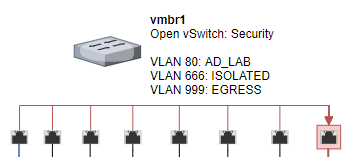
VMBR1is the switch where all of the security and vulnerable infrastructure will be attached for further research. In our lab environment, we have already added some VLANs toVMBR1, because pfSense supports802.1q.- The NIDS is connected to both
VMBR0andVMBR1. Both switches are configured such that the ports where the IDS is plugged in are mirror ports and every other port will send a copy of every Ethernet frame to the IDS.
Order of Operations
Click here to view this diagram in a new tab
- Configure the Wazuh Indexer container
- This is the database where event data will be stored
- Any alerts that are picked up by Wazuh will be shipped here
- Configure the Wazuh Manager container
- This is the SIEM that will collect the logs from any agents
- Agents are running on endpoints on our network
- The agents are HIDS which will forward event data to the SIEM
- You can also forward syslog to Wazuh for processing as well if you cannot install the agent on a host
- Configure the Wazuh Dashboards container
- Wazuh Dashboards serves three purposes:
- A web server that displays dashboards about alerts data
- A Wazuh API client that can control certain features in Wazuh
- A Wazuh Indexer API client that queries the database
- Wazuh Dashboards serves three purposes:
- Configure the NIDS node container
- This is the network intrusion detection system
- It runs the following applications to generate network event data
- Suricata compares packets against a set of rules for anomalies
- Zeek adds lots of metadata about packets
- Wazuh agent sends alert data to the SIEM
- Install Wazuh Agents on Servers and Desktops
- These are the endpoints to be monitored
- They can be configured to ingest any log and send to the Wazuh Manager
- The Wazuh Manager will receive the logs and attempt to decode them and parse them for an alertable event
Desired End State
- NIDS Node
- Installed Suricata and Zeek
- Configured network interfaces
- Capturing mirrored packets and analyzing them
- Wazuh agent is installed and shipping alerts to Wazuh Manager
- Wazuh Manager
- Wazuh software installed and running
- Accepting inputs from agents
- Analyzing and sending to Wazuh Indexer
- Wazuh Indexer
- Receiving inputs from Wazuh Manager
- Wazuh Dashboards
- Successfully connecting to Wazuh Indexer and Dashboards APIs
- Wazuh Agents
- Wazuh agent installed on any server or workstation to be monitored
- As long as the endpoint can establish a TCP/IP connection with the Wazuh Manager, it can ship the logs
Stage Your Containers
Log into Proxmox and create four Linux Containers for your infrastructure.
- Wazuh Indexer
- Hostname: wazuh-indexer
- Debian LXC (latest release)
- Memory: 4 GiB (1 GiB swap) – 8 GiB recommended
- 2 CPU cores – 4 CPU cores recommended
- 25 GB disk (good enough for a lab)
- Set your network (and VLAN) as desired
- Set your DNS domain and servers as desired
- Wazuh Dashboards
- Hostname: wazuh-dashboards
- Debian LXC (latest release)
- Memory: 512 MiB (512 MiB swap) - at least 1024 MiB recommended
- 2 CPU cores
- 10 GB storage
- Set your network (and VLAN) as desired
- Set your DNS domain and servers as desired
- Wazuh Manager
- Hostname: wazuh-manager
- Debian LXC (latest release)
- Memory: 1 GiB (512 MiB swap)
- 2 CPU cores
- 10 GB storage
- Set your network (and VLAN) as desired
- Set your DNS domain and servers as desired
- NIDS node
- Hostname: nids-node
- Debian LXC (latest release)
- Memory: 4 GiB (1 GiB swap)
- 4 CPU cores
- 50 GB storage (good enough for a lab)
- Set your network (and VLAN) as desired
- Set your DNS domain and servers as desired
DHCP Reservations
After you create the containers do the following:
- Make a note of
- Each container's hostname
- Each container's MAC address
- Log into your home router (or DHCP server)
- Assign a static DHCP reservation to the hosts's MAC address
- Use the hostname of the container
- Assign the reservations to the correct VLAN (where applicable)
Wazuh Components
Since Wazuh 4.3, the default database that stores the alerts from Wazuh Manager is the Wazuh Indexer.
- The Wazuh Indexer is a fork of the OpenSearch Indexer.
- The Wazuh Dashboards is a fork of the OpenSearch Dashboards.
- OpenSearch is based off a fork of Elasticsearch from several years ago and has morphed into its own product, but looks and acts very similar to Elasticsearch.
In this section, we are going to setup the Wazuh core infrastructure with the aid of some installation scripts provided by the Wazuh team.
Wazuh Indexer Container
Log into the Wazuh Indexer container and complete these steps.
Update and Download Dependencies and Installation Files
curl commands below pull the Wazuh installation files for version 4.3. Be sure to grab the latest installation files.apt clean && apt update && apt upgrade -y
apt install -y curl dnsutils net-tools sudo gnupg
cd /tmp
curl -sO https://packages.wazuh.com/4.3/wazuh-install.sh
curl -sO https://packages.wazuh.com/4.3/config.ymlModify Installation Variables in config.yml
This file will set all of the installation variables. Pay careful attention and replace the following templates with the correct values of your Linux Containers.
<wazuh-indexer-hostname><wazuh-indexer-ip><wazuh-manager-hostname><wazuh-manager-ip><wazuh-dashboards-hostname><wazuh-dashboards-ip>
For example, I've named my Wazuh Indexer wazuh-indexer-1 and it's IP address is 10.148.148.6 . Set your configuration accordingly.
You are telling the Wazuh Indexer how to communicate with the other services running on the other containers.
nodes:
  # Wazuh indexer nodes
  indexer:
    - name: <wazuh-indexer-hostname>
      ip: <wazuh-indexer-ip>

  # Wazuh server nodes
  # Use node_type only with more than one Wazuh manager
  server:
    - name: <wazuh-manager-hostname>
      ip: <wazuh-manager-ip>

  # Wazuh dashboard node
  dashboard:
    - name: <wazuh-dashboards-hostname>
      ip: <wazuh-dashboards-ip>
Create Configuration Files and Certificates
cd /tmp
bash wazuh-install.sh --generate-config-files --ignore-check
Run the Installation Script
Replace <wazuh-indexer-hostname> with the hostname of your Linux container.
cd /tmp
bash wazuh-install.sh --wazuh-indexer <wazuh-indexer-hostname> --ignore-check
bash wazuh-install.sh --start-cluster --ignore-check
Example: --wazuh-indexer wazuh-indexer --ignore-check
Copy the wazuh-install-files.tar File
wazuh-install-files.tar. Copy this file to ALL servers that you created beforehand. You can use the scp utility or a Python web server. There are many options, the choice is yours.The files should be placed in the /tmp directory on the target hosts.
scp /tmp/wazuh-install-files.tar root@wazuh-dashboards-container-ip:/tmp/wazuh-install-files.tar
scp /tmp/wazuh-install-files.tar root@wazuh-manager-container-ip:/tmp/wazuh-install-files.tar
Prevent Unplanned Upgrades
You should plan to upgrade your Wazuh infrastructure in such a way that maintains the availability and integrity of your SIEM. Unplanned upgrades can cause incompatibilities and lead to time-consuming restorations and/or reinstallations.
wazuh-indexer package later using apt install wazuh-indexer, you will have to re-hold the package using apt-mark hold wazuh-indexerapt-mark hold wazuh-indexerWazuh Manager Container
Log into the Wazuh Manager container and complete these steps.
Update and Download Dependencies and Installation Files
apt clean && apt update && apt upgrade -y
apt install -y curl dnsutils net-tools sudo gnupg
cd /tmp
ls wazuh-install-files.tar
curl -sO https://packages.wazuh.com/4.3/wazuh-install.sh
Run the Installation Script
Replace <wazuh-manager-hostname> with the hostname of your Linux container.
cd /tmp
bash wazuh-install.sh --wazuh-server <wazuh-manager-hostname> --ignore-check
Example: --wazuh-server wazuh-manager
Rotate Wazuh Manager Logs to Save Disk Space
nano /var/ossec/etc/ossec.confAdd the line <rotate_interval>1d</rotate_interval> to the <global> section as shown below:
<ossec_config>
  <global>
    <rotate_interval>1d</rotate_interval>
Press CTRL + X, then y, then Enter to save your changes. Restart the Wazuh manager: systemctl restart wazuh-manager.
Delete Stale Logs to Save Disk Space
Since this is a lab environment, I'm not too worried about log retention or shipping them off to cold storage. I'm just going to create a cron job to delete logs older than 30 days.
crontab -eRun this command as the root user to edit the crontab
If prompted to choose an editor, choose nano or vim, whichever suits your comfort level; nano being more beginner-friendly.
# Run every day at 0400
# Find directories older than 30 days and recursively delete
0 4 * * * find /var/ossec/logs/alerts -type d -mtime +30 -exec rm -rf {} \; > /dev/null 2>&1
0 4 * * * find /var/ossec/logs/archives -type d -mtime +30 -exec rm -rf {} \; > /dev/null 2>&1
Add these cron jobs below any existing ones
When finished — assuming you're using nano — press CTRL + x and then y to save and exit the crontab.
Prevent Unplanned Upgrades
You should plan the upgrades of your Wazuh manager and Wazuh agents. Having agents that are higher versions than your Wazuh manager can lead to compatibility issues.
wazuh-manager package later using apt install wazuh-manager, you will have to re-hold the package using apt-mark hold wazuh-managerapt-mark hold wazuh-managerWazuh Dashboards Container
Log into the Wazuh Dashboards container and complete these steps.
Update and Download Dependencies and Installation Files
apt clean && apt update && apt upgrade -y
apt install -y curl dnsutils net-tools sudo gnupg
cd /tmp
ls wazuh-install-files.tar
curl -sO https://packages.wazuh.com/4.3/wazuh-install.sh
Run the Installation Script
Replace <wazuh-dashboards-hostname> with the hostname of your Linux container.
cd /tmp
bash wazuh-install.sh --wazuh-dashboard <wazuh-dashboards-hostname> --ignore-check
Example: --wazuh-dashboard wazuh-dashboards
Once the installation finishes, you will see the:
- URL of the Dashboards web interface
- Dashboards username
- Dashboards password
Prevent Unplanned Upgrades
Again, plan your Wazuh infrastructure upgrades. Putting the packages on hold prevents unplanned upgrades, which can lead to loss of data and lengthy restoration of service.
wazuh-dashboard package later using apt install wazuh-dashboard, you will have to re-hold the package using apt-mark hold wazuh-dashboardapt-mark hold wazuh-dashboardNIDS Node Container
Configure Network Interfaces
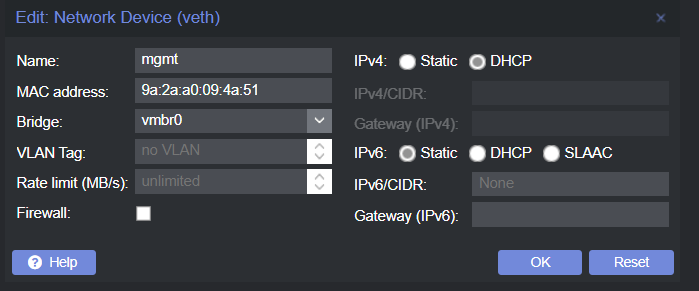
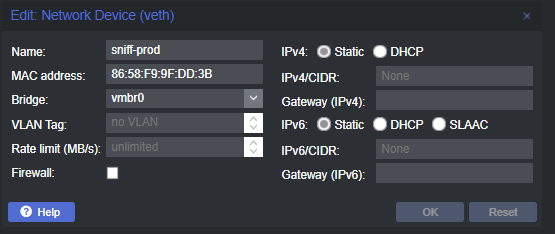
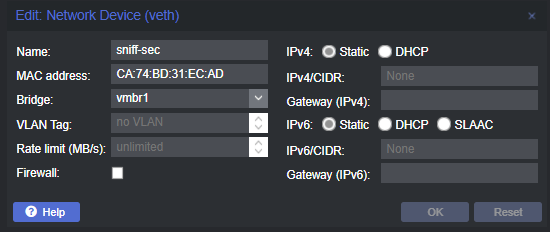
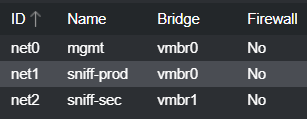
We are going to add three network interfaces to the NIDS node. One interface will be plugged into vmbr0 and this interface will be used for management – such as SSH. Another interface will be plugged into vmrb0 and will be used to receive packets on a SPAN port. The third interface will be plugged into vmbr1 and will be used to receive packets on a SPAN port.

mgmt (The management interface where you will log into the server)
sniff-prod (no DHCP reservation needed)
sniff-sec (no DHCP reservation needed)
Bring Sniff Interfaces up
nano /etc/network/interfacesAdd these interface configurations to the bottom of the file.
auto sniff-prod
iface sniff-prod inet manual

auto sniff-sec
iface sniff-sec inet manual
Restart the networking daemon. This will kill your SSH session.
systemctl restart networkingSuricata
Install and Configure Suricata
apt install -y suricatanano /etc/suricata/suricata.yaml- eve-log:
enabled: yes
filetype: regular #regular|syslog|unix_dgram|unix_stream|redis
filename: eve.jsonEnsure eve.json output is enabled
af-packet:
  - interface: sniff-prod
    # ... removed by author for brevity
    # ... nothing to change

  - interface: sniff-sec
    cluster-id: 98
    # ...
    # ...
    # ... removed by author for brevity
    # ... nothing to change
Note the 'sniff-prod' and 'sniff-sec' interfaces
suricata.yaml file. Please close the file and save your changes.Configure Suricata Rule Sources
sudo suricata-update update-sourcessudo suricata-update list-sources --freeList Suricata rule sources that do not require a key / token / license
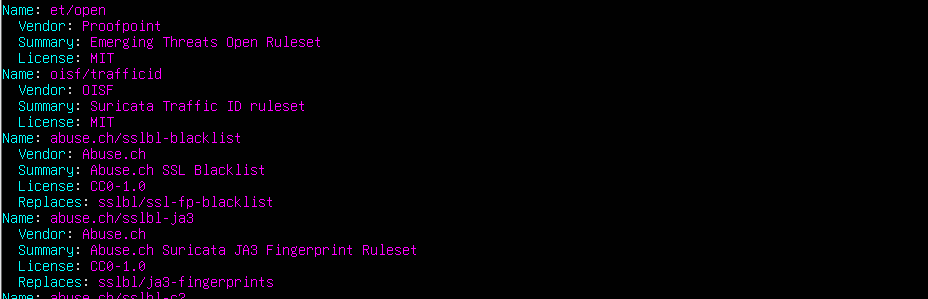
sudo suricata-update enable-source et/openEnable the et/open source
sudo suricata-update enable-source tgreen/huntingsudo suricata-update enable-source stamus/lateralsudo suricata-update enable-source aleksibovellan/nmapsudo suricata-updateAdd Cron Jobs
crontab -e# Run every day at 2 AM and at reboot
# Update the Suricata rulesets with the latest detections
@reboot /usr/bin/suricata-update
0 2 * * * /usr/bin/suricata-update
# Run every day at 4 AM
# Find files older than 30 days and delete
0 4 * * * find /var/log/suricata -maxdepth 1 -mtime +30 -type f -exec rm -f {} \; > /dev/nullAdd these cron jobs below any existing ones
When finished — assuming you're using nano — press CTRL + x and then y to save and exit the crontab.
Enable and Start the Suricata Daemon
sudo systemctl enable --now suricatasystemctl status suricata
sudo top or sudo htop and if needed, add more CPU and RAM to the box.Zeek
Install Zeek on the NIDS Node
root user on the NIDS node.download.opensuse.org repo below is set to Debian_11. Ensure you are using the correct repo for your OS release (e.g. bullseye, bookworm, trixie, etc).echo 'deb http://download.opensuse.org/repositories/security:/zeek/Debian_11/ /' > /etc/apt/sources.list.d/zeek.list
curl -fsSL https://download.opensuse.org/repositories/security:zeek/Debian_11/Release.key | gpg --dearmor > /etc/apt/trusted.gpg.d/security_zeek.gpg
apt update && apt install -y zeekConfigure Zeek on the NIDS Node
Configure Log Tagging
Since Zeek will be logging multiple protocols and input types as it captures them from the wire, we want to tag the various protocols, so that it is easier to parse the logs with the JSON decoder later. Especially so, because many of the log types contain overlapping field names.
nano /opt/zeek/share/zeek/site/log_tags.zeekkey:value pair to each JSON log, identifying the Zeek analyzer used to generate the specific log with the zeek_log_type key. This is useful for identifying event types in our rules (shown below).redef record DNS::Info += {
zeek_log_type: string &default="DNS" &log;
};
redef record Conn::Info += {
zeek_log_type: string &default="CONN" &log;
};
redef record Weird::Info += {
zeek_log_type: string &default="WEIRD" &log;
};
redef record SSL::Info += {
zeek_log_type: string &default="SSL" &log;
};
redef record SSH::Info += {
zeek_log_type: string &default="SSH" &log;
};
redef record HTTP::Info += {
zeek_log_type: string &default="HTTP" &log;
};
redef record DCE_RPC::Info += {
zeek_log_type: string &default="DCE_RPC" &log;
};
redef record DHCP::Info += {
zeek_log_type: string &default="DHCP" &log;
};
redef record SMB::CmdInfo += {
zeek_log_type: string &default="SMB_CMD" &log;
};
redef record SMB::FileInfo += {
zeek_log_type: string &default="SMB_FILES" &log;
};
redef record SMB::TreeInfo += {
zeek_log_type: string &default="SMB_MAPPING" &log;
};
redef record NTLM::Info += {
zeek_log_type: string &default="NTLM" &log;
};
redef record SNMP::Info += {
zeek_log_type: string &default="SNMP" &log;
};
redef record SMTP::Info += {
zeek_log_type: string &default="SMTP" &log;
};
redef record Files::Info += {
zeek_log_type: string &default="FILES" &log;
};
redef record Software::Info += {
zeek_log_type: string &default="SOFTWARE" &log;
};
redef record Notice::Info += {
zeek_log_type: string &default="NOTICE" &log;
};Configure JSON Output
Wazuh Manager has a JSON parser which will decode any incoming logs, so no custom parsing needed to ingest Zeek logs.
echo '@load policy/tuning/json-logs.zeek' >> /opt/zeek/share/zeek/site/local.zeekecho '@load log_tags.zeek' >> /opt/zeek/share/zeek/site/local.zeekLoad our tagging parser when Zeek is deployed
Configure Packet Capture
nano /opt/zeek/etc/networks.cfg10.0.0.0/8
172.16.0.0/12
192.168.0.0/16
169.254.0.0/16
127.0.0.0/8Monitors all IPv4 addresses in the RFC1918 specification
nano /opt/zeek/etc/node.cfgnids-node-container-ip with your NIDS node's IP address[logger]
type=logger
host=localhost
[manager]
type=manager
host=nids-node-container-ip
[proxy-1]
type=proxy
host=localhost
[worker-1]
type=worker
host=localhost
interface=sniff-prod
[worker-2]
type=worker
host=localhost
interface=sniff-sec/opt/zeek/bin/zeekctl checkCheck for configuration errors
Warning: zeekctl option UseWebSocket is set, but websockets non-functional: Failed to import websockets module - is it installed? (ModuleNotFoundError("No module named 'websockets'"))You can run
apt install -y python3-websockets and re-run /opt/zeek/bin/zeekctl check again./opt/zeek/bin/zeekctl deployRun Zeek with the configurations
Add Zeek Cron Jobs
I am trimming logs older than 30 days. You can adjust your timeframe as required for your environment.
crontab -e# Start Zeek at system boot
@reboot /opt/zeek/bin/zeekctl deploy
# Run every day at 4 AM
# Find directories older than 30 days and recursively delete
0 4 * * * find /opt/zeek/logs -type d -mtime +30 -exec rm -rf {} \; > /dev/null 2>&1Add these cron jobs below any existing ones
When finished — assuming you're using nano — press CTRL + x and then y to save and exit the crontab.
Wazuh Agent
Install the Wazuh Agent on the NIDS Node
root on the NIDS nodecurl -s https://packages.wazuh.com/key/GPG-KEY-WAZUH | gpg --no-default-keyring --keyring gnupg-ring:/usr/share/keyrings/wazuh.gpg --import && chmod 644 /usr/share/keyrings/wazuh.gpg
echo "deb [signed-by=/usr/share/keyrings/wazuh.gpg] https://packages.wazuh.com/4.x/apt/ stable main" | tee -a /etc/apt/sources.list.d/wazuh.list
apt update
apt install wazuh-agent
systemctl enable wazuh-agentPrevent Unplanned Upgrades of the Wazuh Agent
wazuh-agent package later using apt install wazuh-agent, you will have to re-hold the package using apt-mark hold wazuh-agentapt-mark hold wazuh-agentConfigure the Wazuh Agent to Collect Logs
sudo nano /var/ossec/etc/ossec.conf<ossec_config>
<client>
<server>
<address>WAZUH_MANAGER</address>Change "WAZUH_MANAGER" to your Wazuh Manager's IP address
  <client_buffer>
    <!-- Agent buffer options -->
    <disabled>yes</disabled>
Set the agent buffer to "disabled", because the NIDS node will be sending a lot of logs
<ossec_config>
  <localfile>
    <log_format>json</log_format>
    <location>/var/log/suricata/eve.json</location>
    <ignore type="PCRE2">.+\"event_type":.+"stats".+</ignore>
  </localfile>
  <localfile>
    <log_format>json</log_format>
    <location>/opt/zeek/logs/current/*.log</location>
    <ignore type="PCRE2">.+\"metric_type\".+</ignore>
  </localfile>
</ossec_config>
Use the <ignore> statement to filter out Suricata stats and Zeek telemetry.log which are quite verbose
systemctl restart wazuh-agentAdd the Zeek Decoders and Rules
When Zeek generates logs, it is going to output as JSON. The Wazuh Agent will read the log files under /opt/zeek/logs/current/ and ship them to the Wazuh Manager.
As mentioned before, Wazuh has a built-in JSON decoder. So, it can already read the logs coming from Zeek. However, this alone is not enough for alerting. We need to parse the JSON Zeek logs even further to output the target log lines.
This is what the Zeek decoder will do... parse the JSON logs, and narrow down even further on events to define Zeek logs as:
- Connection logs (conn.log)
- DNS logs (dns.log)
- SSL logs (ssl.log)
- Etc.
Log into Wazuh Manager
root on the Wazuh Manager containerAdd the Decoders
nano /var/ossec/etc/decoders/zeek_decoders.xmlWhat you'll see below is the <parent>json</parent> syntax indicates the stream to read the logs from. The <regex></regex> line indicates how to identify the event that's happened. The <sort></sort> indicates how to label and sort the events.
The event lines ts, uid, id.orig_h, etc, can be found by using grep or cat on the /opt/zeek/logs/current and seeing which log lines they come from. The <order>srcip</order> — in this case — logs the id.orig_h event as srcip.
id.orig_h key to srcip allows for GeoIP enrichment with the default pipelines in Wazuh. If you were not to rewrite this, you'd have to modify the filebeat pipeline to add the GeoIP enrichment for the id.orig_h key. So, normalizing in this fashion whenever you have custom source / destination IP keys is ideal./var/ossec/etc/decoders/zeek_decoders.xml
<!-- Zeek Log Type Identifier -->
<decoder name="zeek_decoder">
<parent>json</parent>
<regex>"zeek_log_type":"(\w+)"</regex>
<order>zeek_log_type</order>
</decoder>
<!-- DNS Query -->
<decoder name="zeek_decoder">
<parent>json</parent>
<regex>"ts":\d+</regex>
<order>timestamp</order>
</decoder>
<decoder name="zeek_decoder">
<parent>json</parent>
<regex>"uid":"(\w+)"</regex>
<order>uid</order>
</decoder>
<decoder name="zeek_decoder">
<parent>json</parent>
<regex>"id.orig_h":"(\d+.\d+.\d+.\d+)"</regex>
<order>srcip</order>
</decoder>
<decoder name="zeek_decoder">
<parent>json</parent>
<regex>"id.orig_p":(\d+)</regex>
<order>srcport</order>
</decoder>
<decoder name="zeek_decoder">
<parent>json</parent>
<regex>"id.resp_h":"(\d+.\d+.\d+.\d+)"</regex>
<order>dstip</order>
</decoder>
<decoder name="zeek_decoder">
<parent>json</parent>
<regex>"id.resp_p":(\d+)</regex>
<order>dstport</order>
</decoder>
<decoder name="zeek_decoder">
<parent>json</parent>
<regex>"proto":"(\w+)"</regex>
<order>protocol</order>
</decoder>
<decoder name="zeek_decoder">
<parent>json</parent>
<regex>"trans_id":(\d+)</regex>
<order>DNS_transaction_id</order>
</decoder>
<decoder name="zeek_decoder">
<parent>json</parent>
<regex>"query":"(\.+)"</regex>
<order>dnsquery</order>
</decoder>
<decoder name="zeek_decoder">
<parent>json</parent>
<regex>"rcode_name":"(\w+)"</regex>
<order>dns_response_code</order>
</decoder>
<decoder name="zeek_decoder">
<parent>json</parent>
<regex>"AA":(\w+)</regex>
<order>authoritative_answer</order>
</decoder>
<decoder name="zeek_decoder">
<parent>json</parent>
<regex>"TC":(\w+)</regex>
<order>truncate_flag</order>
</decoder>
<decoder name="zeek_decoder">
<parent>json</parent>
<regex>"RD":(\w+)</regex>
<order>recursion_desired_flag</order>
</decoder>
<decoder name="zeek_decoder">
<parent>json</parent>
<regex>"RA":(\w+)</regex>
<order>recursion_avalable_flag</order>
</decoder>
<decoder name="zeek_decoder">
<parent>json</parent>
<regex>"Z":(\d+)</regex>
<order>reserved_for_future_use</order>
</decoder>
<decoder name="zeek_decoder">
<parent>json</parent>
<regex>"answers":(["\.+"])</regex>
<order>resolved_by</order>
</decoder>
<decoder name="zeek_decoder">
<parent>json</parent>
<regex>"TTLs":([\d+])</regex>
<order>time_to_live</order>
</decoder>
<decoder name="zeek_decoder">
<parent>json</parent>
<regex>"rejected":(\w+)</regex>
<order>query_rejected</order>
</decoder>
<!-- Additional DNS metadata -->
<decoder name="zeek_decoder">
<parent>json</parent>
<regex>"service":"(\w+)"</regex>
<order>application_layer_protocol</order>
</decoder>
<decoder name="zeek_decoder">
<parent>json</parent>
<regex>"duration":(\d+.\d+)</regex>
<order>duration_of_the_connection</order>
</decoder>
<decoder name="zeek_decoder">
<parent>json</parent>
<regex>"orig_bytes":(\d+)</regex>
<order>byte_send_by_originator</order>
</decoder>
<decoder name="zeek_decoder">
<parent>json</parent>
<regex>"resp_bytes":(\d+)</regex>
<order>byte_sent_by_responder</order>
</decoder>
<decoder name="zeek_decoder">
<parent>json</parent>
<regex>"conn_state":"(\w+)"</regex>
<order>connection_state</order>
</decoder>
<decoder name="zeek_decoder">
<parent>json</parent>
<regex>"local_orig":(\w+)</regex>
<order>local_origin</order>
</decoder>
<decoder name="zeek_decoder">
<parent>json</parent>
<regex>"local_resp":(\w+)</regex>
<order>local_response</order>
</decoder>
<decoder name="zeek_decoder">
<parent>json</parent>
<regex>"missed_bytes":(\d+)</regex>
<order>missed_bytes_might_packet_loss</order>
</decoder>
<decoder name="zeek_decoder">
<parent>json</parent>
<regex>"history":\w+</regex>
<order>history</order>
</decoder>
<decoder name="zeek_decoder">
<parent>json</parent>
<regex>"orig_pkts":(\d+)</regex>
<order>packet_sent_by_origin</order>
</decoder>
<decoder name="zeek_decoder">
<parent>json</parent>
<regex>"orig_ip_bytes":(\d+)</regex>
<order>ip_layer_bytes_from_origin</order>
</decoder>
<decoder name="zeek_decoder">
<parent>json</parent>
<regex>"resp_pkts":(\d+)</regex>
<order>packet_sent_by_responder</order>
</decoder>
<decoder name="zeek_decoder">
<parent>json</parent>
<regex>"resp_ip_bytes":(\d+)</regex>
<order>ip_layer_bytes_sent_by_responder</order>
</decoder>
<decoder name="zeek_decoder">
<parent>json</parent>
<regex>"ip_proto":(\d+)</regex>
<order>protocol_number_ip_header</order>
</decoder>
<!-- Software related -->
<decoder name="zeek_decoder">
<parent>json</parent>
<regex>"host":"(\d+.\d+.\d+.\d+)"</regex>
<order>host_ip</order>
</decoder>
<decoder name="zeek_decoder">
<parent>json</parent>
<regex>"software_type":"(\.+)"</regex>
<order>software_type</order>
</decoder>
<decoder name="zeek_decoder">
<parent>json</parent>
<regex>"name":"(\w+)"</regex>
<order>software_name</order>
</decoder>
<decoder name="zeek_decoder">
<parent>json</parent>
<regex>"unparsed_version":"(\.+)"</regex>
<order>software_version</order>
</decoder>
<decoder name="zeek_decoder">
<parent>json</parent>
<regex>"host_p":(\d+)</regex>
<order>host_port</order>
</decoder>
<!-- SSL/TLS Connection Decoders -->
<decoder name="zeek_decoder">
<parent>json</parent>
<regex>"version":"(\.+)"</regex>
<order>ssl_version</order>
</decoder>
<decoder name="zeek_decoder">
<parent>json</parent>
<regex>"cipher":"(\.+)"</regex>
<order>ssl_cipher</order>
</decoder>
<decoder name="zeek_decoder">
<parent>json</parent>
<regex>"curve":"(\.+)"</regex>
<order>ssl_curve</order>
</decoder>
<decoder name="zeek_decoder">
<parent>json</parent>
<regex>"validation_status":"(\.+)"</regex>
<order>ssl_validation_status</order>
</decoder>
<decoder name="zeek_decoder">
<parent>json</parent>
<regex>"server_name":"(\.+)"</regex>
<order>ssl_server_name</order>
</decoder>
<decoder name="zeek_decoder">
<parent>json</parent>
<regex>"established":(\w+)</regex>
<order>ssl_established</order>
</decoder>
<decoder name="zeek_decoder">
<parent>json</parent>
<regex>"resumed":(\w+)</regex>
<order>ssl_resumed</order>
</decoder>
<decoder name="zeek_decoder">
<parent>json</parent>
<regex>"ssl_history":"(\.+)"</regex>
<order>ssl_history</order>
</decoder>
<decoder name="zeek_decoder">
<parent>json</parent>
<regex>"cert_chain_fps":"(\.+)"</regex>
<order>ssl_cert_fingerprint</order>
</decoder>
<decoder name="zeek_decoder">
<parent>json</parent>
<regex>"next_protocol":"(\.+)"</regex>
<order>ssl_next_protocol</order>
</decoder>
Add the Rules
nano /var/ossec/etc/rules/11000-zeek_rules.xmlStarting from the top, not the <group name="zeek,ids,"></group>, which is a way to group alerts across multiple rules files.
Then, the first <rule id="66006" level="5"> looks at the zeek_log_type key in the JSON, which you'll recall is the custom key we injected earlier to identify Zeek log types. If that key contains SSH, we create a level 5 alert, set the description, and filebeat ships it to Wazuh Indexer. If it doesn't contain SSH, we continue down through the list of rules until there's a match.
/var/ossec/etc/rules/11000-zeek_rules.xml
<group name="zeek,ids,">
  <rule id="66006" level="5">
    <field name="zeek_log_type">SSH</field>
    <description>Zeek: SSH Connection</description>
  </rule>
  <rule id="66007" level="5">
    <field name="zeek_log_type">SSL</field>
    <description>Zeek: SSL Connection</description>
  </rule>
  <rule id="66008" level="5">
    <field name="zeek_log_type">DNS</field>
    <description>Zeek: DNS Query</description>
  </rule>
  <rule id="66009" level="5">
    <field name="zeek_log_type">CONN</field>
    <description>Zeek: Connection Log</description>
  </rule>
  <rule id="66010" level="5">
    <field name="zeek_log_type">DCE_RPC</field>
    <description>Zeek: DCE_RPC Log</description>
  </rule>
  <rule id="66011" level="5">
    <field name="zeek_log_type">DHCP</field>
    <description>Zeek: DHCP Log</description>
  </rule>
  <rule id="66012" level="5">
    <field name="zeek_log_type">FILES</field>
    <description>Zeek: FILES Log</description>
  </rule>
  <rule id="66013" level="5">
    <field name="zeek_log_type">HTTP</field>
    <description>Zeek: HTTP Log</description>
  </rule>
  <rule id="66014" level="5">
    <field name="zeek_log_type">NOTICE</field>
    <description>Zeek: NOTICE Log</description>
  </rule>
  <rule id="66015" level="5">
    <field name="zeek_log_type">NTLM</field>
    <description>Zeek: NTLM Log</description>
  </rule>
  <rule id="66016" level="5">
    <field name="zeek_log_type">SMB_CMD</field>
    <description>Zeek: SMB_CMD Log</description>
  </rule>
  <rule id="66017" level="5">
    <field name="zeek_log_type">SMB_FILES</field>
    <description>Zeek: SMB_FILES Log</description>
  </rule>
  <rule id="66018" level="5">
    <field name="zeek_log_type">SMB_MAPPING</field>
    <description>Zeek: SMB_MAPPING Log</description>
  </rule>
  <rule id="66019" level="5">
    <field name="zeek_log_type">SMTP</field>
    <description>Zeek: SMTP Log</description>
  </rule>
  <rule id="66020" level="5">
    <field name="zeek_log_type">SNMP</field>
    <description>Zeek: SNMP Log</description>
  </rule>
  <rule id="66021" level="5">
    <field name="zeek_log_type">SOFTWARE</field>
    <description>Zeek: SOFTWARE Log</description>
  </rule>
  <rule id="66022" level="5">
    <field name="zeek_log_type">WEIRD</field>
    <description>Zeek: WEIRD Log</description>
  </rule>
  <rule id="66023" level="0">
    <if_sid>66008</if_sid>
    <field name="dnsquery">cti.wazuh.com</field>
    <description>Zeek: DNS Query (ignore Wazuh CTI domain)</description>
  </rule>
</group>
systemctl restart wazuh-managerRestart the Wazuh Manager daemon to adopt the new decoders and rules
Mirror Traffic to the Sniff Interfaces
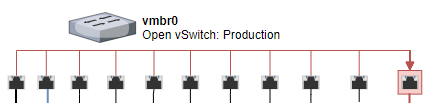
Explaining the Open vSwitch SPAN Ports
You are creating the SPAN ports on the virtual switches in Proxmox. Recall that the NIDS node has three network interfaces.
net0gets an IP address from the router. We can log into the server on this interface.net1does not get an IP address. This is one of the packet capture interfaces.net2does not get an IP address. This is one of the packet capture interfaces.
If you open a shell on the Proxmox server, you can see the interfaces assigned to your NIDS node container. Here is an example from my Proxmox server, where my NIDS node container has the ID of 208.
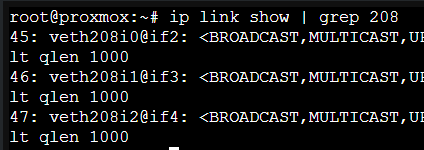
The interfaces are shown in order here:
veth208i0is mymgmtinterfaceveth208i1is mysniff-prodinterfaceveth208i2is mysniff-secinterface
I want to mirror all traffic from every port on the production switch to veth208i1 and all traffic from every port on the security switch to veth208i2.
Be sure to replace
<CTID> with your NIDS Node container ID.Production Switch
ovs-vsctl -- --id=@p get port veth<CTID>i1 -- --id=@m create mirror name=nidsProd select-all=true output-port=@p -- set bridge vmbr0 mirrors=@movs-vsctlis the Open vSwitch control programid=@p get port veth<CTID>i1- Store the switch port of this interface in
@p @pis a variable we can reference for later
- Store the switch port of this interface in
id=@m create mirror name=nidsProd select-all=true output-port=@p- Create a SPAN port called
nidsProdand store it in variable@m - Select all interfaces on the switch
- Mirror them to
output-port@p(the variable from above)
- Create a SPAN port called
set bridge vmbr0 mirrors=@m- Add the new mirror configuration to the
vmbr0switch
- Add the new mirror configuration to the
Security Switch
ovs-vsctl -- --id=@p get port veth<CTID>i2 -- --id=@m create mirror name=nidsSec select-all=true output-port=@p -- set bridge vmbr1 mirrors=@movs-vsctlis the Open vSwitch control programid=@p get port veth<CTID>i2- Store the switch port of this interface in
@p @pis a variable we can reference for later
- Store the switch port of this interface in
id=@m create mirror name=nidsSec select-all=true output-port=@p- Create a SPAN port called
nidsSecand store it in variable@m - Select all interfaces on the switch
- Mirror them to
output-port@p(the variable from above)
- Create a SPAN port called
set bridge vmbr1 mirrors=@m- Add the new mirror configuration to the
vmbr1switch
- Add the new mirror configuration to the
Persist Reboots
You can't just create the port mirroring once, set it, and forget it. You'll have to implement a script of some sort – Bash, PowerShell, Python, etc. – so that the following is accomplished:
- Recreate the port mirroring at reboots
- Check the port mirroring at regular intervals to make sure it hasn't stopped for any reason
Cron Jobs
<CTID> with your NIDS Linux Container's ID in Proxmox! If you've followed this guide in the configuration of your NIDS, it has one interface on each switch. veth###i1 is the interface on the production switch, veth###i2 is the interface on the security switch.crontab -e# Run every minute (no need for redundant @reboot job)
# Check to Ensure that Port Mirroring is configured
# The || condition on the right is triggered if the command on the left fails
# Effectively, attempt to start the NIDS container and create the port mirror if the mirror config doesn't exist
# Production Switch
* * * * * ( /usr/bin/ovs-vsctl get Mirror nidsProd name 2>/dev/null 1>/dev/null ) || ( /usr/sbin/pct start <CTID> 2>/dev/null ; sleep 1 ; /usr/bin/ovs-vsctl -- --id=@p get port veth<CTID>i1 -- --id=@m create mirror name=nidsProd select-all=true output-port=@p -- set bridge vmbr0 mirrors=@m )
# Security Switch
* * * * * ( /usr/bin/ovs-vsctl get Mirror nidsSec name 2>/dev/null 1>/dev/null ) || ( /usr/sbin/pct start <CTID> 2>/dev/null ; /usr/bin/ovs-vsctl -- --id=@p get port veth<CTID>i2 -- --id=@m create mirror name=nidsSec select-all=true output-port=@p -- set bridge vmbr1 mirrors=@m )Add these cron jobs below any existing ones
When finished — assuming you're using nano — press CTRL + x and then y to save and exit the crontab.
Installing Wazuh Agents on Endpoints (HIDS)
The Wazuh agent is a host intrusion detection system (HIDS). The purpose of Wazuh agents is to monitor endpoints for security configuration issues and integrity issues with the file system, operating system, and much more.
Firewall Rules
The default protocol for Wazuh Agents to talk to the Wazuh Manager is tcp and the agents send logs to the manager on ports 1514 and 1515. So, depending on where you've placed your Wazuh Manager, ensure that your Wazuh Agents can send traffic to tcp/1514, udp/1514, tcp/1515, and udp/1515 at the Wazuh Manager's IP address.
Logging into Wazuh Dashboard

https://<wazuh-dashboard-container-ip>. Ignore any certificate / TLS warnings, as the service is using a self-signed certificate on the web server.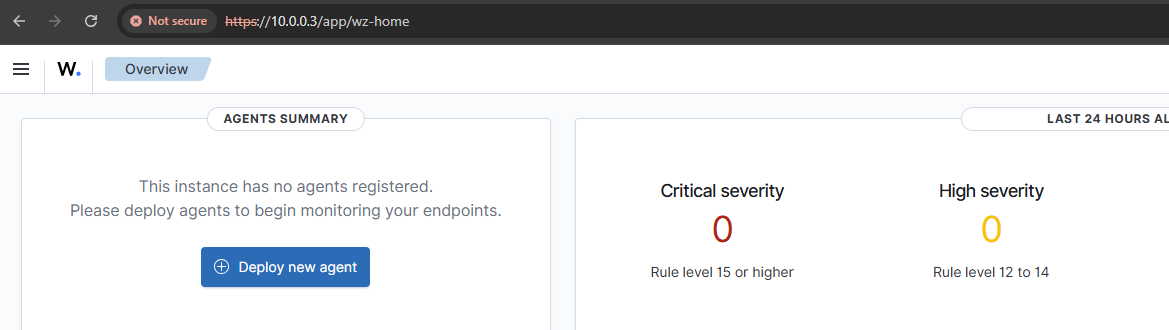
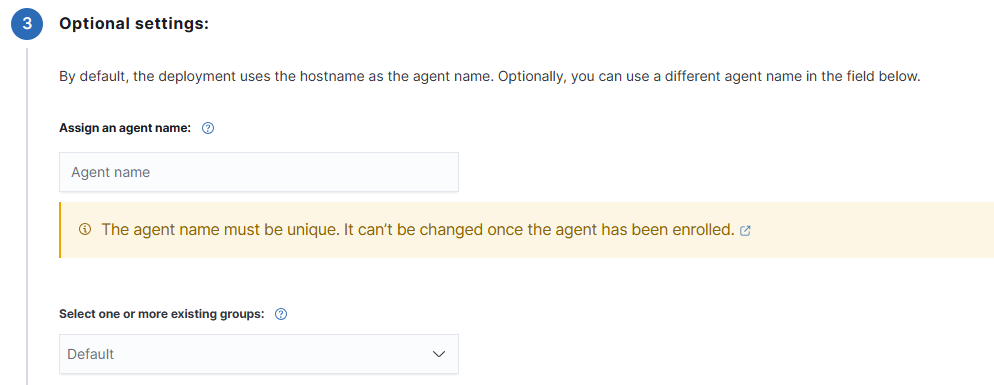
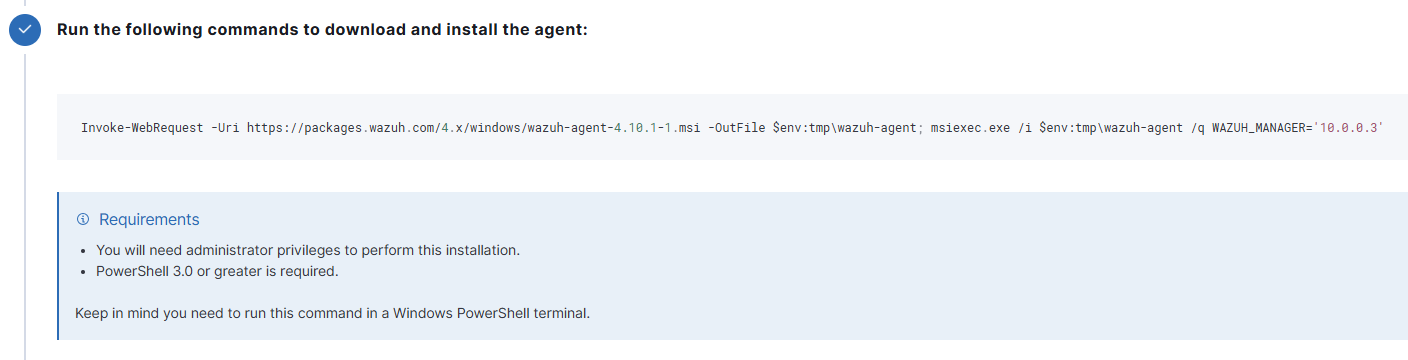
Example: Installing on Windows

apt-mark hold or disable the Wazuh yum or apt package repositories. On Windows, you manually upgrade by installing the .msi.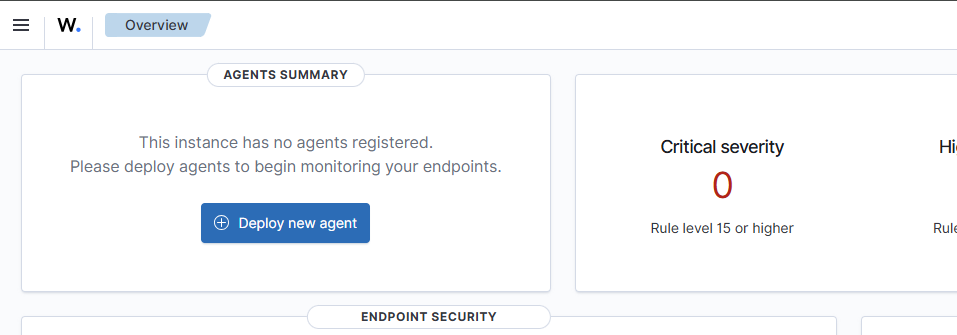
+ Deploy new agent button in the Wazuh Manager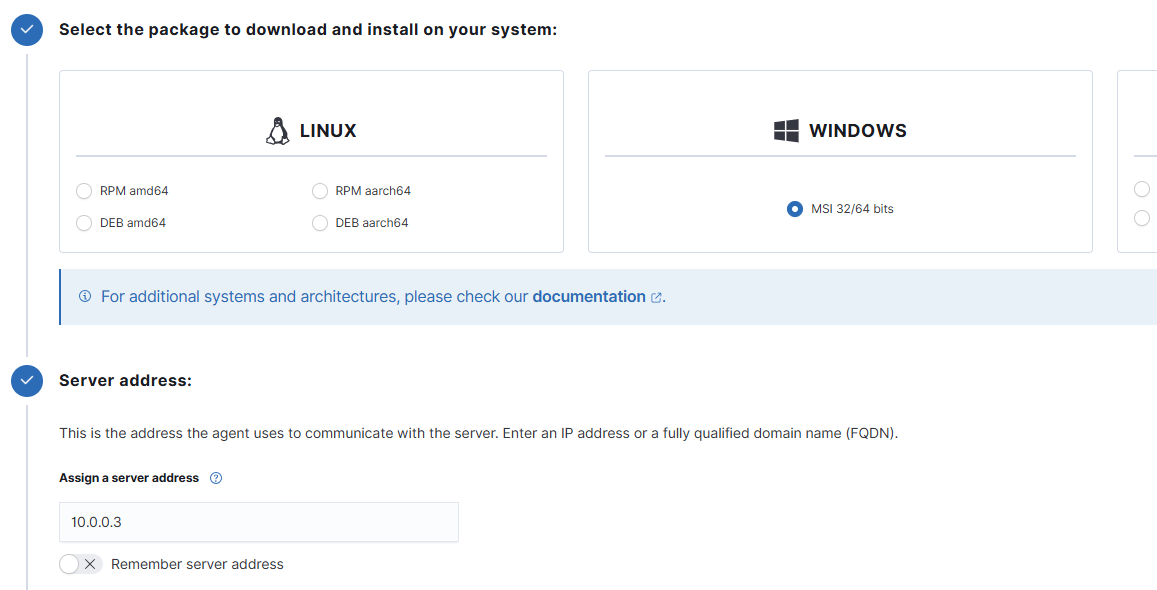
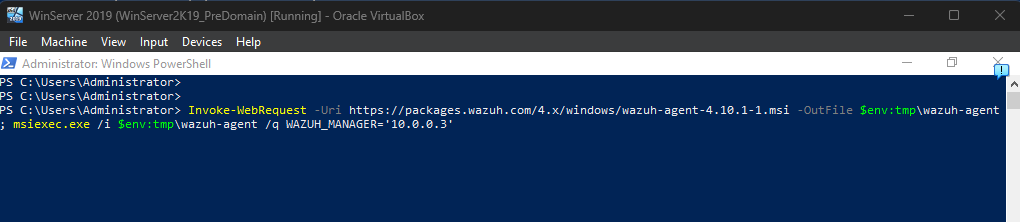
Start-Service WazuhSvcOnce installed, start the service
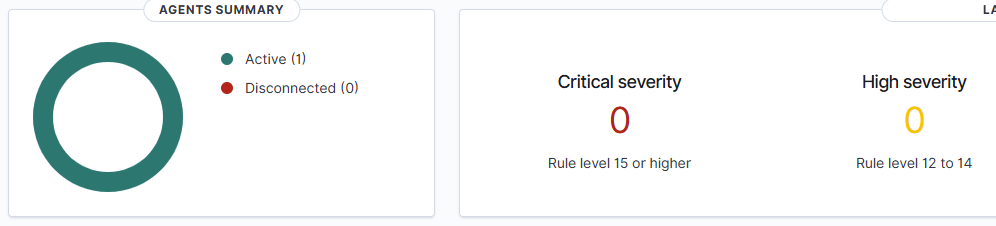
1 active agent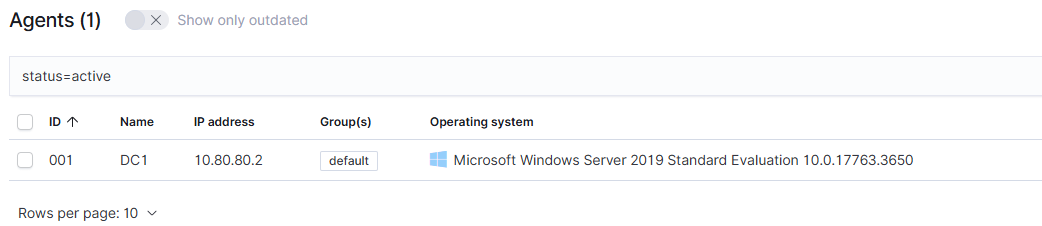
Integrate Sysmon
This is a great way to extend the monitoring capabilities on your Windows hosts. In this article, I show you how to:
- Download the Sysmon ruleset for Wazuh Manager
- Install Sysmon on Windows hosts
- Create a Wazuh Agent group and add Windows hosts to the group
- And ingest the Sysmon logs from your Windows endpoints using the Wazuh Agent
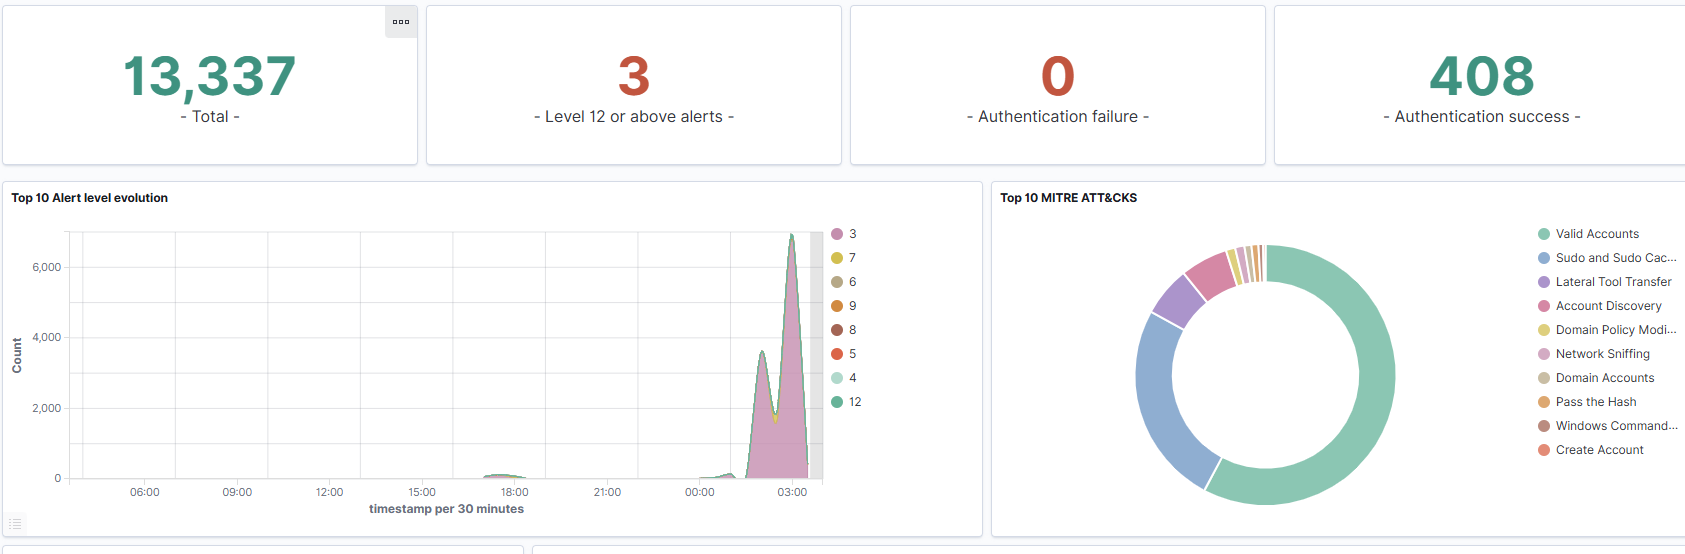
Testing Capabilities
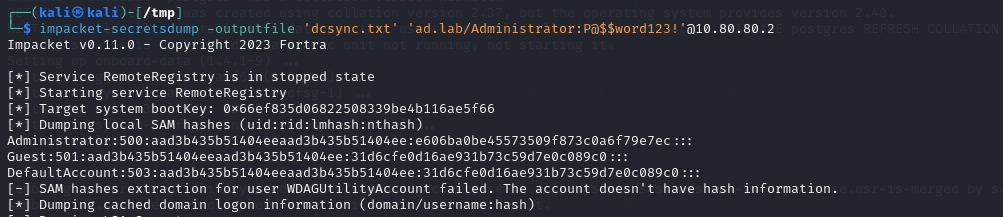

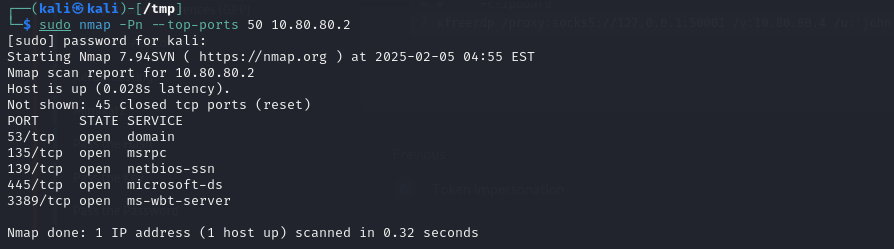


psexec.py
Important: Define an Index Management Policy
You REALLY want to do this now as opposed to later.
- Save your disk space
- Reduce stressful troubleshooting hours
- Trim your indices and improve performance
Do it now! Please.
Troubleshooting the SIEM
Changing Default Passwords
Wazuh Infrastructure Admin Password
 Wazuh
Wazuh
Alerts Stopped Registering in Wazuh Dashboards
In my past experience, this has almost always been due to hitting the maximum number of shards or running out of disk space.
If you haven't already done so, consider looking into an Index Management Policy.
I would recommend inspecting things in the following order:
- Make sure the Wazuh Manager service is running
- Make sure the Filebeat service is running on the Wazuh Manager server
- Check Filebeat logs
- If you see logs on hitting the shard limit
- Consider adding another Wazuh Indexer node (see below)
- Clean up old indices with an index management policy
- If you see logs on hitting the shard limit
- Check Filebeat logs
- Make sure the Wazuh Indexer service is running
- Check Wazuh Indexer logs
- Make sure you have enough disk space available
- If your disk is 95% full, Wazuh Indexer will prevent additional writes
- Consider adding more disk space and/or another Wazuh Indexer node
- Clean up old indices with an index management policy
- If your disk is 95% full, Wazuh Indexer will prevent additional writes
Wazuh Dashboards Keeps Prompting to Select a Tenant when Logging into the Web Portal
Resolution: Need to disable multi-tenancy as it does not apply to Wazuh
- SSH into the Wazuh Dashboards container and edit the
/etc/wazuh-dashboard/opensearch_dashboards.ymlfile - Ensure these lines are present and/or match
opensearch_security.multitenancy.enabled: falseExtending Session Timeout in Wazuh Dashboards

Follow-Up Activities
A Quick Sanity Check
As you've witnessed, there is a lot of parts to a SIEM setup, especially if you want to have full network AND host coverage. By now, you should have a baseline configuration that consists of:
- Wazuh Indexer to store logs being sent by Filebeat on Wazuh Manager
- Wazuh Dashboard to allow search and visualization of these logs, as well as integration with Wazuh Manager using the Wazuh plugin and API client
- Wazuh Manager to receive, process, and transmit inbound network and host logs to Wazuh Indexer
- NIDS Node to receive packets via SPAN port from both switches in the lab environment and process them with Suricata and Zeek
Extending Wazuh's Capabilities
The folks over at OpenSecure have done a really fantastic job at creating content that showcases Wazuh's capabilities and ways to extend it with various integrations. I wholeheartedly recommend taking a look.


Also, have a look at a some of the additional Wazuh content I've written. If I included, everything here, the guide would quickly grow out of scope.
Next Step