Change Log
Jan. 22, 2025: Added steps to demonstrate configuring rsyslog in Wazuh Manager and pfSense to enable logging without the need to install the Wazuh Agent package
Building out Our Capabilities
This is an extension of my original home lab guide here:
I hope to continue adding more SIEM, hunting, and detection content. I've really enjoyed learning more about Wazuh, emulating threats with different attack techniques, and seeing how they present in the SIEM.
Option 1: Wazuh Agent
Enabling FreeBSD Package Repositories
You can install the Wazuh agent on pfSense in two ways:
- Compile the port locally using the FreeBSD source code
- Or, install the Wazuh agent from the FreeBSD package repository
For the sake of time and convenience, I am opting for option 2, and installing the Wazuh agent using the FreeBSD package repository.
FreeBSD package repositories are disabled by default on pfSense installations, as Netgate views unofficial software as a security and compatibility concern. You can read more about their reasoning at the link below.
In order to allow pkg to pull from said repository, we need a couple files:
nano /usr/local/etc/pkg/repos/pfSense.confEdit this file
FreeBSD: { enabled: yes }Set enabled to 'yes'
nano /usr/local/etc/pkg/repos/FreeBSD.confEdit this file next
FreeBSD: { enabled: yes }Set enabled to 'yes' here as well
Installing the Wazuh Agent
Follow the steps to enable the FreeBSD package repositories. Then, open a shell on your pfSense box and run the following commands:
# Update the package cache
pkg update

# Search the package cache for the official agent
pkg search wazuh-agent

# Install the agent
# Replace x.xx.x with your version number
pkg install wazuh-agent-x.xx.x
Revert Package Repositories
When finished with the installation, please refer back to the Enabling FreeBSD Package Repositories section and revert your changes.
- Change back to
FreeBSD: { enabled: no } - Run
pkg cleanandpkg update
Enabling and Starting the Agent
Following installation of the agent, you'll see some output on configuring your agent.
cp /etc/localtime /var/ossec/etc/Now, edit the /var/ossec/etc/ossec.conf file and point it to your Wazuh manager:
<server>
	<address>WAZUH-MANAGER-IP-ADDRESS</address>
</server>
Now, start the Wazuh agent and enable start at boot — using the shell script option per the official documentation:
sysrc wazuh_agent_enable="YES"

# We don't want to remove any original files
# So, we create a symbolic link
ln -s /usr/local/etc/rc.d/wazuh-agent /usr/local/etc/rc.d/wazuh-agent.sh

service wazuh-agent start
Trim your Wazuh agent logs to preserve disk space:
crontab -e# Run every day at 4 AM and delete stale logs older than 30 days
0 4 * * * find /var/ossec/logs/ossec/ -d 1 -mtime +30 -type d -exec rm -rf {} \; > /dev/nullMonitoring Suricata Logs
Enable eve.json Output
Log into your pfSense box and go to Services > Suricata. You should see a list of your interface(s) where Suricata is running.
You'll need to click the Edit button on each interface to make these changes.
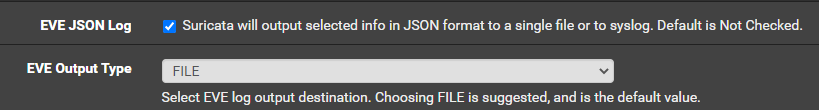
Ensure these two options are set. All of the other eve.json options are your choice on configuring them.
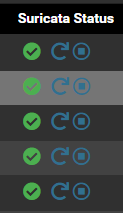
Once you have enabled eve.json output on each desired interface, restart Suricata for the changes to take effect.
Ingesting eve.json with the Wazuh Agent
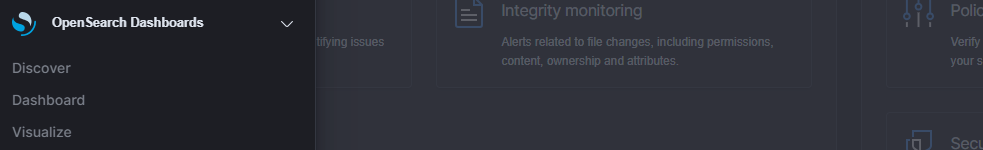
Log into your Wazuh manager using KIbana and go to Wazuh > Management > Groups.
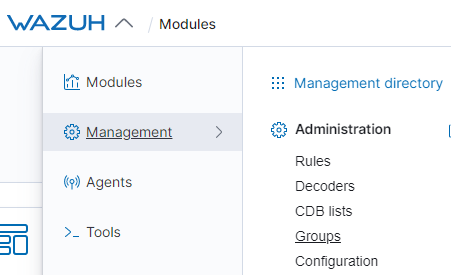
Click on Add new group and name it something like pfSense. Click on your new group and click Manage agents.

Add your pfSense agent to the group and save the changes. Now, with the group created, you can add some pfSense-specific configurations.
Click the Edit group configuration button.

Add the following lines to the group shared configuration. Once you save it, the Wazuh manager will push the changes to any member(s) of the group.
<localfile>
    <log_format>json</log_format>
    <location>/var/log/suricata/*/eve.json</location>
</localfile>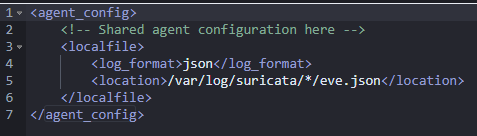
Test Your NIDS
Want to generate some safe alerts and make sure they show up in Wazuh?
 3CORESec
Run this on any host connected to a network monitored by Suricata on the pfSense box. This will generate some false positives and you can check them out in Wazuh.
What About Syslog and Firewall Logs?
Syslog
Fortunately, the Wazuh agent will automatically ingest /var/log/system.log, so no work to be done there.
Firewall Logs
To have the Wazuh agent monitor the pfSense firewall log, just add another <localfile></localfile> directive to the agent.conf file like we did with the eve.json logs before.
Go to Wazuh > Management > Groups and click on the pfSense group we created before. Click on Edit group configuration.

Add this declaration to the configuration file and click Save.
<localfile>
	<log_format>syslog</log_format>
	<location>/var/log/filter.log</location>
</localfile>
A Note on the Firewall Log
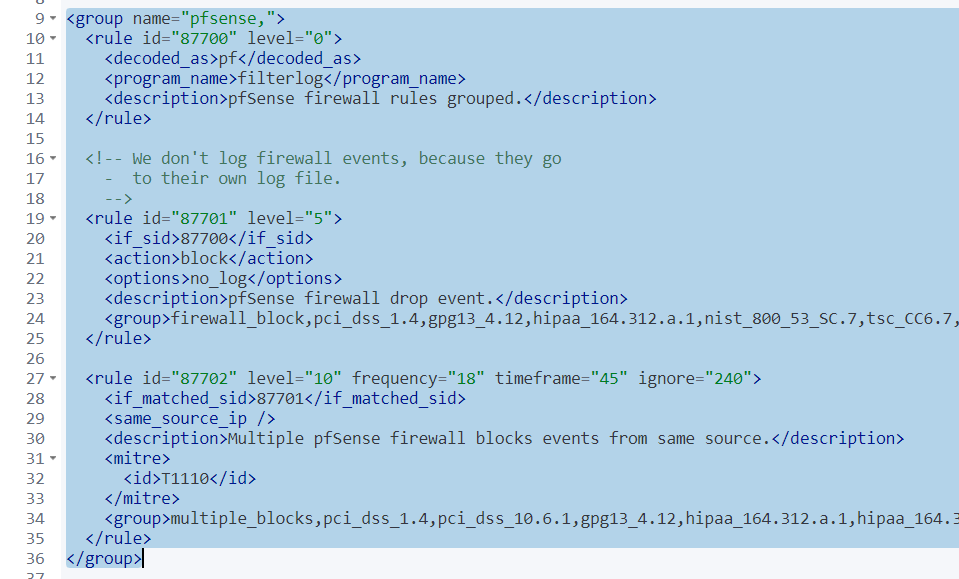
Wazuh Manager has the decoders and rules in place to monitor the output in /var/log/filter.log. You can view the decoders and rules in the source code.
Decoders tell the Wazuh manager how to process the lines of the log output.
wazuhRules tell the Wazuh manager how to take the decoded fields and arrange them in the various rules that will generate logs and/or alerts in the SIEM.
wazuhThere are two pfSense rules:
- pfSense firewall drop event
- Multiple pfSense firewall blocks events from same source
The pfSense firewall drop event rule does not log by default as noted by the <options>no_log</options> line in the rule declaration.
<rule id="87701" level="5">
	<if_sid>87700</if_sid>
	<action>block</action>
	<options>no_log</options>
	<description>pfSense firewall drop event.</description>
	<group>firewall_block,pci_dss_1.4,gpg13_4.12,hipaa_164.312.a.1,nist_800_53_SC.7,tsc_CC6.7,tsc_CC6.8,</group>
</rule>
The Multiple pfSense firewall blocks events from same source rule does log by default.
If you would like the pfSense firewall drop event logged to Wazuh, you can override the rule and I will show you how to do that.
Create a Custom Rule File
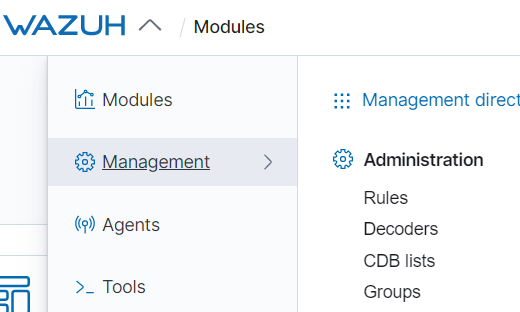
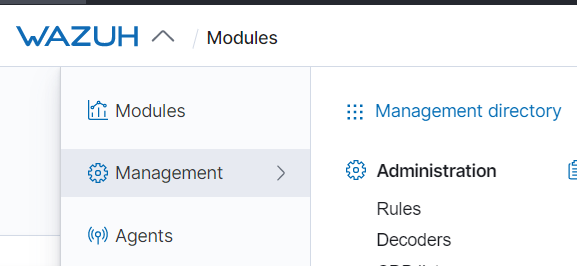
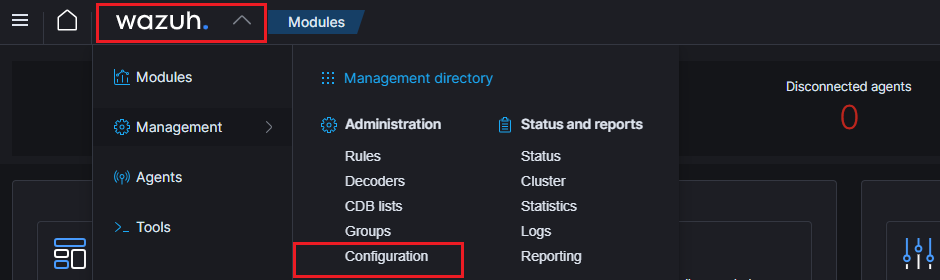
Open the Wazuh menu and go to Management > Rules
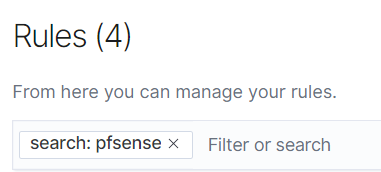
In the search bar, enter the keyword pfsense
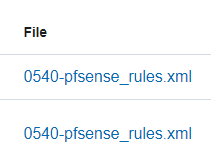
Click on the rules file hyperlink
Copy the entire group declaration from <group> to </group>
Click on the back arrow

Click Add new rules file

Name it something like pfSense-Overrides.xml
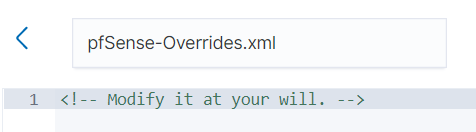
Paste the text you copied into the code editor and modify it such that it looks like this. Three observations here:
- I have added this rule to the
pfSensegroup, the same as the original - The only rule remaining here is the
pfSense firewall drop eventrule - I have removed the
<option>no_log</option>line and added anoverwrite="yes"option to the rule.
<group name="pfsense,">
<rule id="87701" level="5" overwrite="yes">
<if_sid>87700</if_sid>
<action>block</action>
<description>pfSense firewall drop event.</description>
<group>firewall_block,pci_dss_1.4,gpg13_4.12,hipaa_164.312.a.1,nist_800_53_SC.7,tsc_CC6.7,tsc_CC6.8,</group>
</rule>
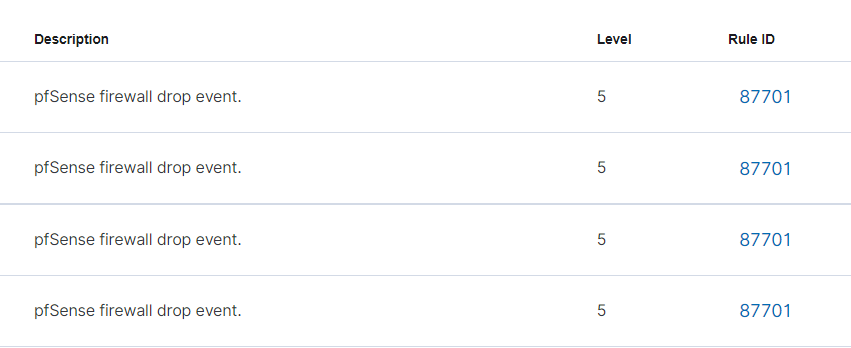
</group>Click Save. It will tell you that the rule will not apply until the Wazuh Manager is restarted. You can restart the manager from this screen.
Now, return to the alerts for your pfSense Wazuh agent and you should now see the firewall drop events.
Troubleshooting Agent Upgrades
I am adding this here as a follow up, to note some issues I had while upgrading from version 4.2 to 4.3. Unfortunately, it seems there were some breaking changes between these major versions.
When I tried to upgrade my Wazuh Agent with the pkg install wazuh-agent , the installation went fine. But upon reloading the agent service with service wazuh-agent restart , I received this error message:
Could not open file 'queue/sockets/.agent_info' ...I had to do the following to remediate:
- SSH into Wazuh Manager
- Remove the agent from the Manager with
/var/ossec/bin/manage_agents, due to hostname conflicts upon re-adding the agent - Make a backup of your
/var/ossec/etc/ossec.conffile - Uninstal, re-install, and configure the Wazuh Agent on pfSense
- Kill any running processes not terminated by the uninstallation:
kill -9 `pgrep wazuh` - Run
service enable wazuh-agentandservice start wazuh-agent - Re-add the agent to the pfSense group to receive the shared configuration file
Not an ideal situation, but also not a huge pain to remediate. Key notes to be aware of:
- Historic logs for your pfSense agent will be registered to a different agent ID
- Keep this in mind when browsing current/older logs by agent ID
Option 2: rsyslog
Enable Wazuh Syslog Collector


/var/ossec/etc/ossec.conf via ssh as well and then running sudo systemctl restart wazuh-manager<remote>
<connection>secure</connection>
<port>1514</port>
<protocol>tcp</protocol>
<queue_size>131072</queue_size>
</remote>
<!-- SYSLOG CONFIGURATION(S) START HERE -->
<!-- REQUIRE PER-PROTOCOL CONFIGURATIONS -->
<!-- UDP Listener -->
<remote>
<connection>syslog</connection>
<port>514</port>
<protocol>udp</protocol>
<allowed-ips>SYSLOG_SENDER_1</allowed-ips>
<allowed-ips>SYSLOG_SENDER_2</allowed-ips>
<local_ip>WAZUH_MANAGER_IP</local_ip>
</remote>
<!-- TCP Listener -->
<!-- Requires a different port -->
<remote>
<connection>syslog</connection>
<port>515</port>
<protocol>tcp</protocol>
<allowed-ips>SYSLOG_SENDER_1</allowed-ips>
<allowed-ips>SYSLOG_SENDER_2</allowed-ips>
<local_ip>WAZUH_MANAGER_IP</local_ip>
</remote>Substitute WAZUH_MANAGER_IP AND SYSLOG_SENDER_x with the correct IPs. More detail about the configuration options can be found here. Configured to receive syslog over TCP and UDP.

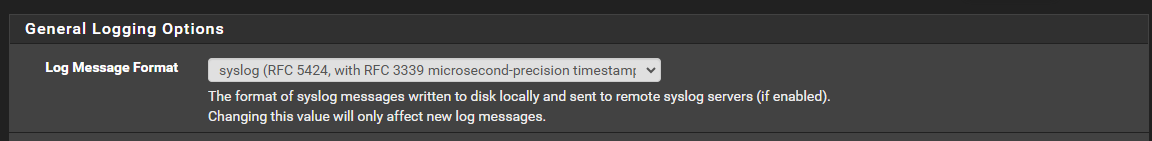
Configure pfSense to Send Syslog
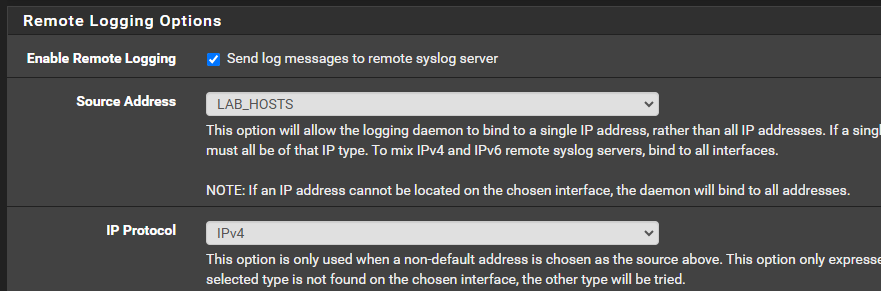
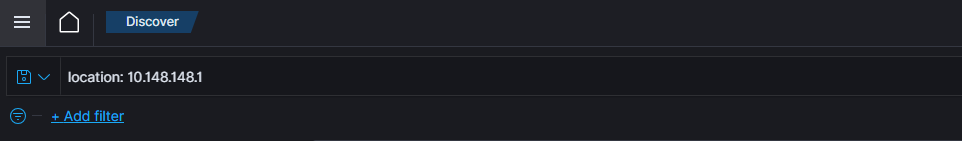
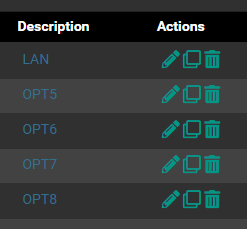
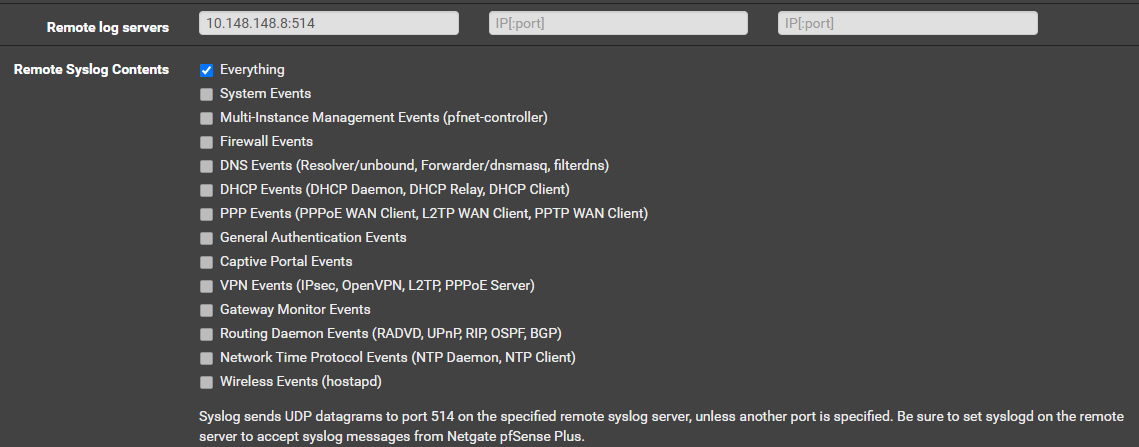
LAB_HOSTS interface, as it's on the 10.148.148.0/24 VLAN. Since pfSense is the default gateway for the VLAN, the traffic will come from 10.148.148.1, thus we configured the <allowed_ip>10.148.148.1</allowed_ip> before.udp/514 -- which aligns with the port we used in the ossec.conf file above. If other hosts require Syslog over TCP, configure to send to tcp/515 per the configuration above.Ensure you configure firewall rules to allow traffic to Wazuh Manager where needed.
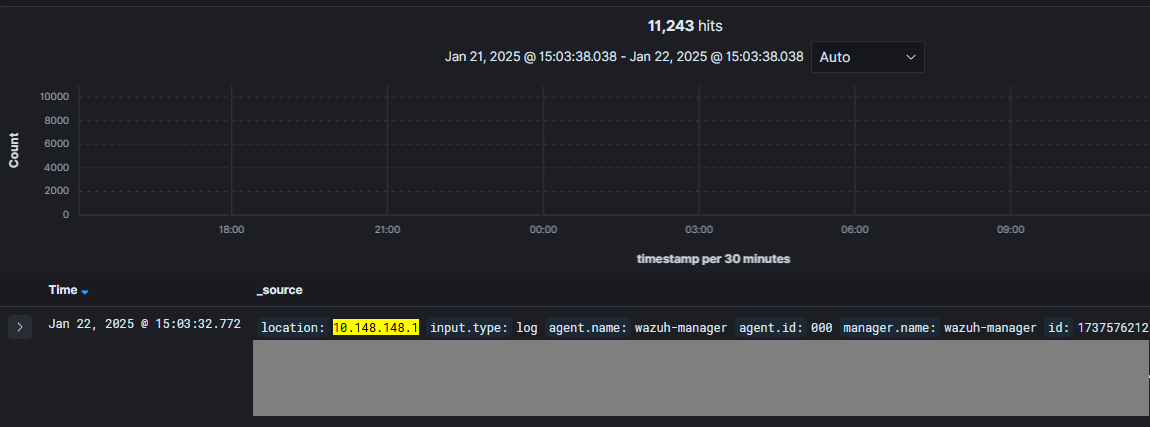
Viewing Logs in Wazuh
>= 3. In a default installation, you'll need to write a custom rule to set specific syslog events to match your rule threshold.In my environment, I've configured
logall_json, such that we log all incoming events that can be read by a valid decoder. In this case, the events are written in syslog format, so should have no problem decoding.Be advised that enabling
logall_json in Wazuh Manager, does add an incredible amount of detail pertaining to logs and events, but it also increases the storage requirements manyfold. So, if you go this route, ensure you have adequate storage for your Wazuh Manager.More information on enabling the logll_json option in Wazuh