
Context is Key
Out of the box, Wazuh is a fantastic SIEM solution. It's got most everything a defender could ask for:
- HIDS solution for log collection
- NIDS integration
- Excellent user interface
- Expansive decoders and rulesets
- Lots of modular integrations
- Active development
- Great open-source community
That said, Wazuh at its default settings, is an alert-focused SIEM. Sure, you can write custom decoders and rules for virtually any event you'd like to alert on. But, that assumes that you know what you're looking for and what you'd like to alert on.
If you're trying to actively hunt for threats, then your ability to hunt is only as good as your alerts. The better way to operate with Wazuh would be:
- Write detection rulesets for what you know and what you learn post-incident,
- Hunt using both your alerts and archived events for context
Log All JSON
If you SSH into your Wazuh Manager server, you will find the main configuration file at /var/ossec/etc/ossec.conf. The <logall_json> option is set to no by default – and understandably so.
By enabling this option, your storage requirements increase a lot. It is best to enable this option only if you have the storage space to do so. But, what does this option do?
Before
The default operation of Wazuh is to do the following:
- Ingest logs from agents and analyze against decoders and rules
- If a log event matches a rule archive it in
/var/ossec/logs/archives/archives.json - Then, if the archived log is greater than or equal to
<log_alert_level>in the/var/ossec/etc/ossec.conffile, log it to/var/ossec/logs/alerts/alerts.json - Filebeat then reads
alerts.jsonand feeds it into Elasticsearch
After
After enabling <logall_json> the new operation is:
- Ingest logs from agents and analyze against decoders and rules
- If a log can be decoded and there is a rule...
- Assign the rule metadata and log in
/var/ossec/logs/archives/archives.json
- Assign the rule metadata and log in
- Or... if a log can be decoded and there is no rule...
- Archive the log in
/var/ossec/logs/archives/archives.jsonwithout any of the rule identifiers
- Archive the log in
- Then, if the archived log is greater than or equal to
<log_alert_level>in the/var/ossec/etc/ossec.conffile, log it to/var/ossec/logs/alerts/alerts.json - Effectively, alerts are still going to
alerts.json, but you're also getting raw log data inarchives.jsonas long as it is decoded. - However, at this point, Filebeat has not been configured to ingest
archives.json
By storing these additional events in addition to alerts, you're giving yourself much more context to find clues before and after an alert is triggered. You give yourself much more room to proactively hunt for threats, as opposed to waiting for an alert to trigger.
logall_json, if Wazuh doesn't know how to decode your log, then it will not archive it. So, you have to have -- at a minimum -- a decoder to read your log event. If the log is in JSON, Wazuh can decode it out of the box.Log Management
It's also worth noting that you can configure Wazuh to rotate logs in /var/ossec/logs by editing the option /var/ossec/etc/ossec.conf file. However, this is just log rotation, and not deletion.
If you want to delete the logs in addition to rotating them, it is recommended to set up a cron job to do so. For example, I have specified this cron job on my Wazuh Manager server.
# Run every day at 0400
# Find directories older than 30 days and recursively delete
0 4 * * * find /var/ossec/logs/alerts -type d -mtime +30 -exec rm -rf {} \; > /dev/null 2>&1
0 4 * * * find /var/ossec/logs/archives -type d -mtime +30 -exec rm -rf {} \; > /dev/null 2>&1
Archiving All Events
Enable Logall_JSON
- Edit
/var/ossec/etc/ossec.conf- Set
logall_jsontoyes
- Set
- Edit
/etc/filebeat/filebeat.yml- Set archive
enabled: true
- Set archive
- Restart Filebeat:
systemctl restart filebeat - Restart Wazuh Manager:
systemctl restart wazuh-manger
De-Duplicating Logs
Quick Recap
- You've enabled
logall_json - You've enabled the
archivesfilebeat module - Now, both
archives.jsonandalerts.jsonfiles are being shipped to Wazuh Indexer. You're receiving duplicate data from both sources.- Recall that if a rule exists, Wazuh will assign the rule metadata and store in
archives.jsonandalerts.json
- Recall that if a rule exists, Wazuh will assign the rule metadata and store in
- We're going to add an index pattern to read the Archives logs, which will contain the alerts data
- So, there's no need to log
alerts.jsonany longer
- So, there's no need to log
Disable the Alerts Module
nano /etc/filebeat/filebeat.yamlfilebeat.modules:
- module: wazuh
alerts:
enabled: false
archives:
enabled: truealerts are now set to enabled: false
systemctl restart filebeatWhat we are doing here is telling Filebeat to stop reading /var/ossec/logs/alerts/alerts.json, thereby discontinuing the writing of documents to the wazuh-alerts-* index pattern.
/etc/filebeat/filebeat.yml file again and enabled the alerts module.New Index Pattern
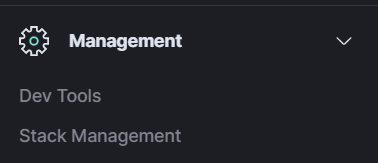
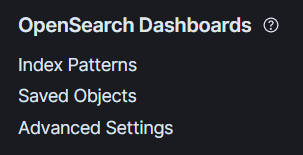
Log into Wazuh Dashboards (aka Kibana) and open the hamburger menu in the top-left. Then, go to Stack Management and Index Patterns.

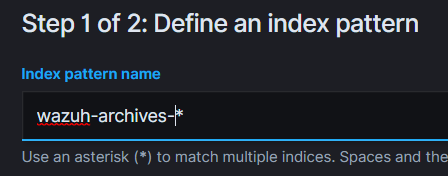
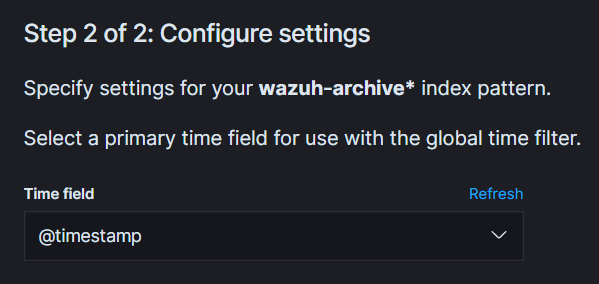
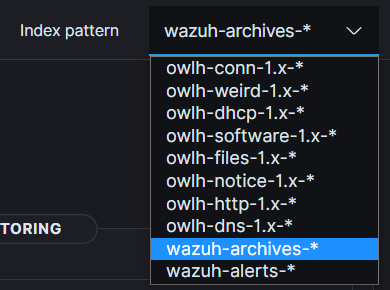
Save the pattern. Now, when you open the Wazuh application or the Discover application, you should see the newly created wazuh-archives-* pattern in the top-right. This will allow you to search for documents in this index (as opposed to wazuh-alerts-*).
What About Old Alerts Indices?
If you log into Wazuh Dashboards, you'll still see the wazuh-alerts-* index pattern. Your old documents will still exist. However, no new documents will be written to the wazuh-alerts-* index pattern.
If you don't already have an Index Management Policy to trim your old indices, I'd encourage you to do so. I've written an article about that here:
If you create an Index Management Policy, eventually your old wazuh-alerts-* documents should be tidied by Elasticsearch when they grow stale. But, if you were to re-enable the Filebeat alerts module. Then, new documents would start writing to the wazuh-alerts-* index pattern again.
If You'd Rather Delete the Old Indices Now...
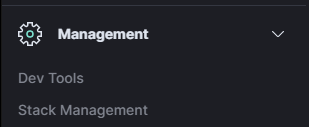
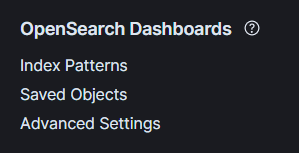
Open the Wazuh Dashboards menu in the top-left and go to Dev Tools.
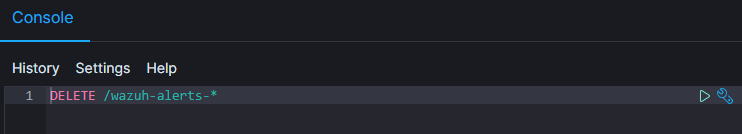
Enter DELETE /wazuh-alerts-* in the console and press the play button to execute the API call. Since we're no longer interested in the wazuh-alerts-* index pattern, and have since disabled the Filebeat module and stopped writing documents with that pattern, it's perfectly safe to run this API call.
Setting a New Default Index Pattern
When you log into Wazuh, the wazuh-alerts-* index pattern is selected by default. Since we are no longer writing to this index pattern, and are now focusing exclusively on wazuh-archives-* , we should change the default index pattern upon login.
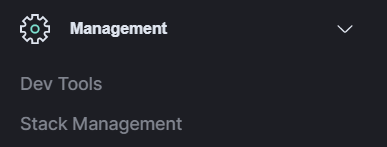
wazuh-archives-* pattern by Filebeat. So, any dependencies that Wazuh has on alerts will still be satisfied by reading this pattern.Log into Wazuh Dashboards (Kibana) and click the hamburger menu in the top-left. Go to Stack Management.
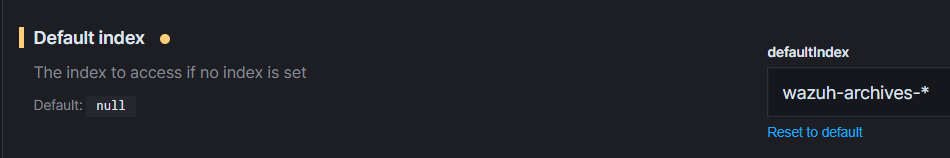
Click Save Changes at the bottom. Log out and log back in to test your changes.