
Extending the Home Lab SIEM Capabilities
This blog post is an extension of my Proxmox home lab SIEM guide. In that guide, I demonstrate how we can set up a Wazuh SIEM and Suricata and Zeek NIDS. You can find that post here.

Installing RITA on the NIDS Node
Current State of the SIEM
If you've followed along with my guide linked above, you'll know that we've already set up the Wazuh SIEM and Suricata and Zeek NIDS, and begun ingesting NIDS logs into Wazuh. However, the Zeek logs we're ingesting from the NIDS are raw Zeek logs and it would be nice to enhance those logs with RITA.
Active Countermeasures have some installation instructions here for installing RITA. In my lab, I'm running a Debian 10 host and the RITA documentation clearly states that this is a supported OS.
 activecm
Using the Installation Script to Install RITA
Using the install.sh script, we will be able to easily accomplish the following goals:
- Skip Zeek installation
- Install MongoDB
- Install RITA
I'll summarize the installation steps for you here:
- SSH into your NIDS node and switch to the root user
- As mentioned in the installation documentation, download
install.shto your NIDS node
# Example command
wget https://github.com/activecm/rita/releases/download/v4.6.0/install.sh -O /tmp/install.sh
- Make the script executable
chmod 700 /tmp/install.sh
- Run the installation script according to our environment
# Install MongoDB and RITA
/tmp/install.sh --disable-zeek

# Set the correct permissions on config.yaml
chmod 600 /etc/rita/config.yaml
- Now, RITA should be installed and Mongo DB should be listening on the loopback interface.
# Confirm MongoDB is runnning
systemctl status mongod

# Enable MongoDB to run at startup
systemctl enable mongod

# Confirm RITA is in the $PATH variable
# You can log out and log back in if there's an issue
which rita
Set Up a Cron Job to Keep a Week's Worth of Rolling Data
We set the chunks to 168 because the rolling data is determined by the frequency of the command being run. Since there will be an hour's spacing between commands, the chunks are "one hour" chunks. Therefore, 1 hour * 24 * 7 == 168 .
# RITA weekly rolling dataset
# Run the command once every hour
# Zeek rolls logs from current to YYYY-mm-dd every hour
# Offsetting by -1 hour will import logs when the clock reaches midnight
0 * * * * /usr/local/bin/rita import --rolling --numchunks 168 /opt/zeek/logs/$(date --date='-1 hour' +\%Y-\%m-\%d) week-dataset
Wait for the cron job to run on the next hour, as you don't want to cause an imbalance with the rolling data structure.
Test RITA Log Imports
# General help message
rita help

# Command-specific help
rita <command> --help

# Test some data imports
# Import the current logs and create a databse called rita-test
rita import /opt/zeek/logs/current rita-test

# Data test analysis
rita show-beacons rita-test

# Delete the test database
rita delete rita-test
Ingesting RITA Output with Wazuh
Enabling Remote Commands on the NIDS Node
If you need to enable this setting on multiple agents, it would be best to use a tool like Ansible to do this at scale.
 Wazuh
Wazuh
Utilizing the SSH session on your NIDS node, edit the /var/ossec/etc/local_internal_options.conf file and append the following lines:
# Logcollector - Whether or not to accept remote commands from the manager
logcollector.remote_commands=1
Now, restart the Wazuh Agent service:
systemctl restart wazuh-agentAdd the Remote Commands to the Shared Configuration
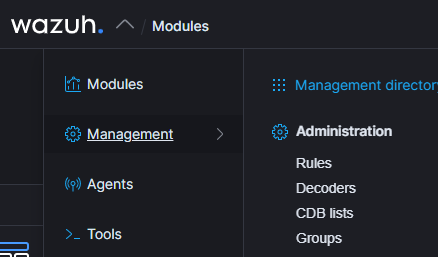
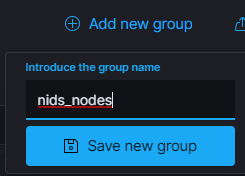
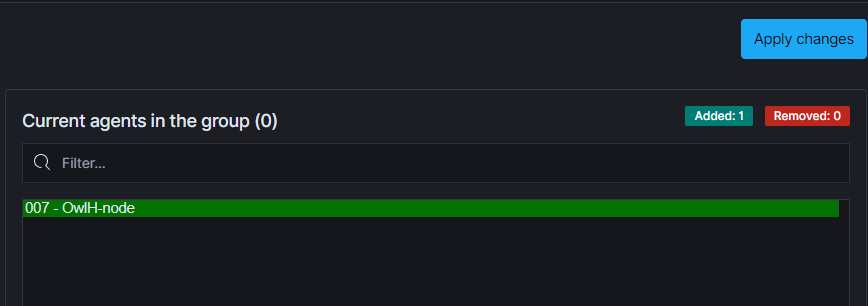
Create the Agent Group
If you don't already have a group for your NIDS agents, let's create one now. Click on the Wazuh menu and go to Management > Groups .


Edit the Shared Configuration
Now, update the group configuration. This will run your command every 10 minutes, so change the frequency to your desired interval.
<agent_config>
    <!-- Shared agent configuration here -->
    <!-- Run show-beacons every 10 minutes -->
    <localfile>
        <log_format>full_command</log_format>
        <command>/usr/local/bin/rita show-beacons week-dataset</command>
        <frequency>600</frequency>
    </localfile>
    <!-- Run show-long-connections every 10 minutes -->
    <localfile>
        <log_format>full_command</log_format>
        <command>/usr/local/bin/rita show-long-connections week-dataset</command>
        <frequency>600</frequency>
    </localfile>
    <!-- Run show-open-connections every 10 minutes -->
    <localfile>
        <log_format>full_command</log_format>
        <command>/usr/local/bin/rita show-open-connections week-dataset</command>
        <frequency>600</frequency>
    </localfile>
    <!-- Run show-exploded-dns every 10 minutes -->
    <localfile>
        <log_format>full_command</log_format>
        <command>/usr/local/bin/rita show-exploded-dns week-dataset</command>
        <frequency>600</frequency>
    </localfile>
    <!-- Run show-useragents every 10 minutes -->
    <localfile>
        <log_format>full_command</log_format>
        <command>/usr/local/bin/rita show-useragents week-dataset</command>
        <frequency>600</frequency>
    </localfile>
</agent_config>
Click Save once you've edited the shared configuration
Add the Custom Rules to Log the Command Output
logall_json option for your Wazuh Manager, you don't need to create the custom ruleset here, as the raw log output will be logged to the wazuh-archives-* index pattern.If you were to create alerts for this output, you'd essentially be duplicating data in your Elasticsearch instance. I am simply going to demonstrate the process here for clarity's sake.
To learn more about the logall_json option, check out my blog post here:
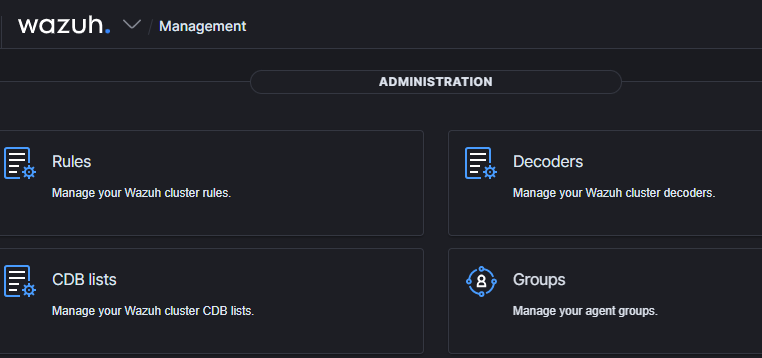
With that out of the way, let's move on and create the rules. Go back to the Management menu and click Rules.

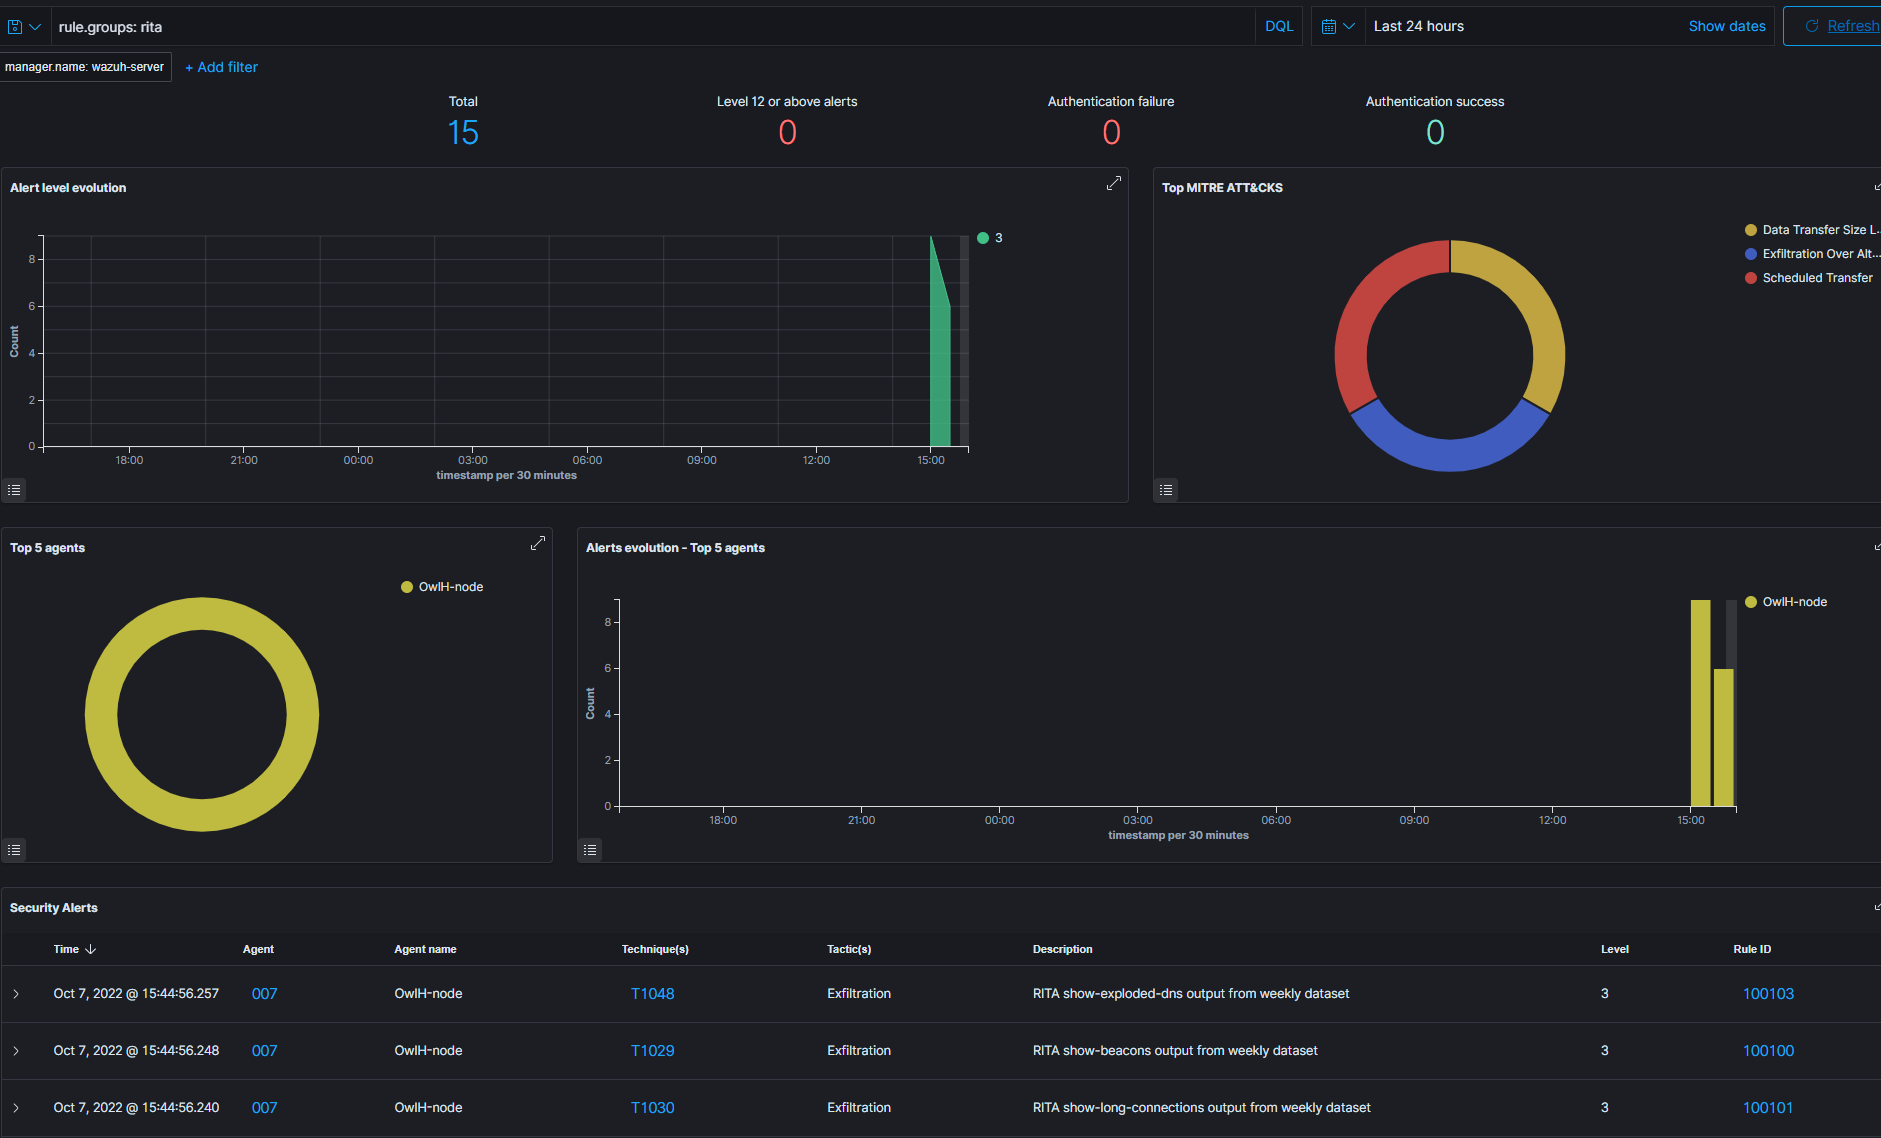
Hierarchically, I'm going to put it next to my OwlH Zeek rules file, so I'll name my file 10636-RITA-rules.xml . Now, let's add some rules in there to alert on the RITA output.
<group name="zeek,ids,rita,">
    <rule id="100100" level="3">
      <if_sid>530</if_sid>
      <match>^ossec: output: '/usr/local/bin/rita show-beacons week-dataset'</match>
      <description>RITA show-beacons output from weekly dataset</description>
      <mitre>
        <id>T1029</id>
      </mitre>
    </rule>

    <rule id="100101" level="3">
      <if_sid>530</if_sid>
      <match>^ossec: output: '/usr/local/bin/rita show-long-connections week-dataset'</match>
      <description>RITA show-long-connections output from weekly dataset</description>
      <mitre>
        <id>T1030</id>
      </mitre>
    </rule>

    <rule id="100102" level="3">
      <if_sid>530</if_sid>
      <match>^ossec: output: '/usr/local/bin/rita show-open-connections week-dataset'</match>
      <description>RITA show-open-connections output from weekly dataset</description>
      <mitre>
        <id>T1020</id>
      </mitre>
    </rule>

    <rule id="100103" level="3">
      <if_sid>530</if_sid>
      <match>^ossec: output: '/usr/local/bin/rita show-exploded-dns week-dataset'</match>
      <description>RITA show-exploded-dns output from weekly dataset</description>
      <mitre>
        <id>T1048</id>
      </mitre>
    </rule>

    <rule id="100104" level="3">
      <if_sid>530</if_sid>
      <match>^ossec: output: '/usr/local/bin/rita show-useragents week-dataset'</match>
      <description>RITA show-useragents output from weekly dataset</description>
      <mitre>
        <id>T1071</id>
      </mitre>
    </rule>
</group>
Click Save . You will be prompted to restart the Wazuh Manager. Please do so when convenient for you.
Wazuh will run the remote command every ten minutes, so it may take some time for the alerts to show up – depending on when the remote command was last run.
Addendum: Keep Logall_JSON and Alert on RITA Only
If you're not using the logall_json option in the Wazuh Manger, you've reached the end of the blog post and should be all set.
Say for example, you've enabled logall_json , but you'd like to keep the alerts output whilst disabling the raw output. You can use a filebeat processor for that.
- Edit
/usr/share/filebeat/module/wazuh/archives/config/archives.yml - Add this processor at the bottom of the file. This will allow us to log events when the
full_logfield matches ourritacommand, but only when they are alerts generated by the custom RITA rules, which should contain aDescriptionto match on. - Again, we're doing this so that we don't duplicate data in Elasticsearch. Either alerts, or raw log data. The choice is yours.
processors:
  - drop_event:
      when:
        and:
          - regexp:
              data.full_log: "^ossec:.*output:.*/usr/local/bin/rita.*"
          - not:
              regexp:
data.description: "^RITA.*"- Be sure to run:
systemctl restart filebeatafter saving your changes.