
What is OwlH?
In a brief summary, OwlH's goal is to help network defenders deploy and manage Network Intrusion Detection Systems (NIDS) at scale. The architecture would look something like this:
- One server acts as the OwlH Manager
- One or many servers act as the NIDS nodes
From there the procedure looks like this:
- You install the OwlH Manager service on the management server, and install the OwlH Node service on the NIDS nodes.
- Then, you install the Wazuh agent, Suricata, and Zeek on the NIDS nodes (more on this in a moment).
- Then, you log into the management server and register your NIDS node(s) with the management server.
- Using the management server you can remotely manage your NIDS node(s) Wazuh agent, Suricata, Zeek, and other configuration files from one pane of glass.
Here is the project's GitHub repository if you would like to take a look.


OwlH Wazuh Rules
Wazuh ships with a baseline set of OwlH rules for Zeek logs, further tightening the OwlH integration into their ecosystem.
wazuhSuricata rules are also evaluated by Wazuh, but in a different ruleset.
wazuhThe Wazuh agent running on each NIDS node ships both Suricata and Zeek logs to the Wazuh manager to be evaluated.
How Does it All Fit Together?
The key to making this as simple and fluid as possible, is ensuring that Suricata and Zeek are outputting logs in JSON. The reason for this is that the Wazuh manager has a built-in JSON decoder, so you don't have to write your own decoder for any of the logs that ship from the NIDS nodes.
Logging
Suricata
When you install Suricata on the NIDS node(s), you'll enable eve.json output. This will output all Suricata logs to /var/log/suricata/eve.json
Zeek
When you install Zeek on the NIDS node(s), you'll add @load policy/tuning/json-logs.zeek to the local.zeek file to ensure that Zeek logs in JSON.
Also, you'll create a custom owlh.zeek file and add an additional property to each log. For example, Zeek can log lots of different protocols including:
- Connections
- DHCP
- DNS
- HTTP
- Much, much more...
In owlh.zeek, you'll add these configurations.
redef record DNS::Info += {
    bro_engine:    string    &default="DNS"    &log;
};
redef record Conn::Info += {
    bro_engine:    string    &default="CONN"    &log;
};
redef record Weird::Info += {
    bro_engine:    string    &default="WEIRD"    &log;
};
redef record SSL::Info += {
    bro_engine:    string    &default="SSL"    &log;
};
redef record SSH::Info += {
    bro_engine:    string    &default="SSH"    &log;
};
redef record HTTP::Info += {
    bro_engine:    string    &default="HTTP"    &log;
};
And, all that you're doing here is saying, for any log type specified here, add this property to the JSON "bro_engine":"TYPE" or as an example, "bro_engine":"HTTP". The reason for this will be explained in more detail ahead, but we want to tag Zeek logs like this, so that the Wazuh Manager can analyze them correctly.
OwlH Analyzer
Now, we've got the following logs configured:
/var/log/suricata/eve.json- Zeek
conn.loghttp.logdns.log- Etc, etc...
The OwlH Analyzer is running on each NIDS node. Its job is to pull all of these log files into a single location: /var/log/owlh/alerts.json
The OwlH Analyzer also has the job of normalizing and enhancing Suricata and Zeek logs. The Analyzer service will:
- Rename certain field keys, so that Wazuh will be able transmit and store the data in the Wazuh Indexer using the correct field names and data types (string, integer, IP address, etc)
- Add IP geolocation data to Suricata and Zeek logs, and ensure this geolocation data can be parsed correctly by Wazuh Indexer
You can log into your OwlH Manager and configure your Analyzer on each NIDS node and tell it which log files to pull in.
Click Nodes
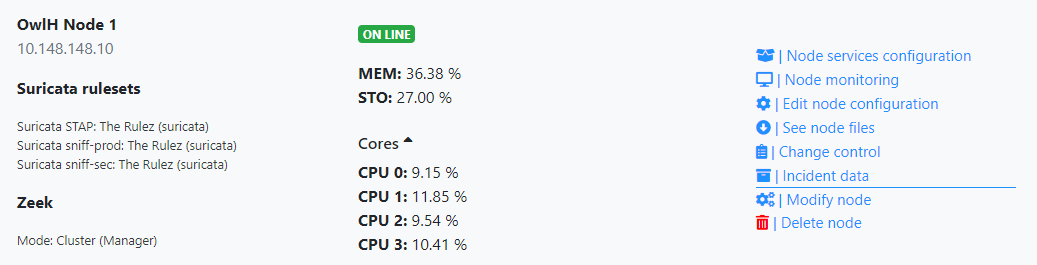
Click Node services configuration
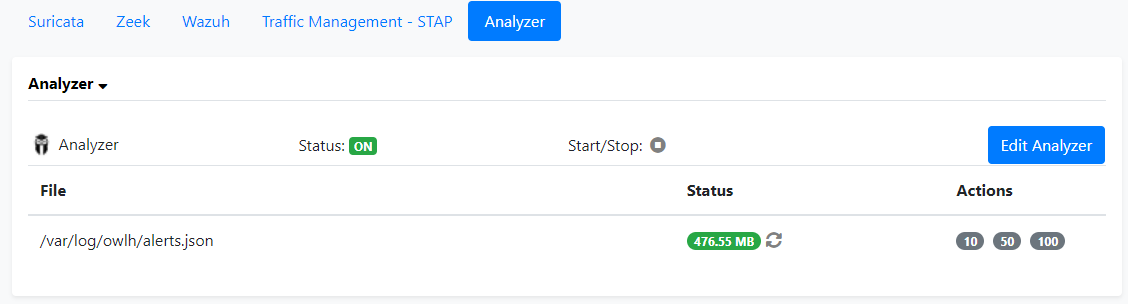
Click Analyzer and click Edit Analyzer
Then, you can configure it here to consume additional files:
    "srcfiles": [
        "/var/log/suricata/eve.json",
        "/opt/zeek/logs/current/conn.log",
        "/opt/zeek/logs/current/dns.log",
        "/opt/zeek/logs/current/weird.log",
        "/opt/zeek/logs/current/http.log"
    ],
My Zeek path is in /opt/zeek as I did not compile from sources, contrary to the official documentation. So, please keep that in mind as you read this.
Ultimately, if you were to run less /var/log/owlh/alerts.json, and you read through it, you would find that it is a giant combination of:
- Suricata logs
- Zeek logs
If you make any changes to this file, always restart the Analyzer service by clicking the Start/Stop button.

Wazuh Agent
The final piece to the configuration is the Wazuh agent, which can also be configured from OwlH Manager.
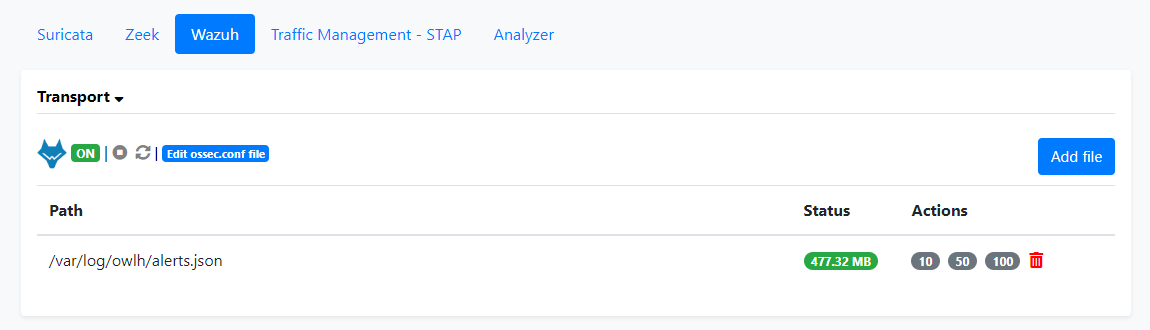
When you click Add file, you're telling the Wazuh agent to consume a log file and ship it to the Wazuh Manager server. Notice we're consuming the /var/log/owlh/alerts.json file, which is the single file the OwlH Analyzer creates when it ingests the log files explained above.
If you make any changes to the Wazuh agent configuration, use the Stop/Start button here to restart the service.
Alerting
Wazuh Manager
The Wazuh agent on the NIDS node(s) is consuming /var/log/owlh/alerts.json, which – again – is just a giant combination of JSON log output from Suricata and Zeek.
The Wazuh agent ships the JSON output to the Wazuh Manager server. So, from here the process goes:
- Decode the JSON logs using the built-in JSON decoder
- Scan the fields for any matches against rules
- If there is a match against a rule, re-encode the output to JSON and store the alert data in
/var/ossec/logs/alerts/alerts.json
OwlH Rules
Let's take a look at an example rule, from the OwlH ruleset:
  <rule id="66003" level="5">
    <field name="bro_engine">DNS</field>
    <description>Zeek: DNS Query</description>
  </rule>
Remember before that we are tagging Zeek logs with an additional field: "bro_engine":"TYPE". Well, this particular rule will trigger if the Zeek logs coming from the nodes has the line "bro_engine":"DNS". And the alert will be stored as a Level 5 alert in /var/ossec/logs/alerts/alerts.json.
Filebeat
Filebeat is running on the Wazuh Manager server. Filebeat's job is to read a log file and ship it to the ELK stack backend.
Filebeat can also be configured with modules. When you're installing Wazuh Manager and OwlH, you're also going to install the Filebeat modules for those logs.
Filebeat modules are stored in /usr/share/filebeat/module/. In this particular case, we're interested in the modules:
/usr/share/filebeat/module/wazuh//usr/share/filebeat/module/owlh/
Let's explore those further.
/usr/share/filebeat/module/wazuh/
We're interested in the following files and subdirectories:
alerts/manifest.yml- Tells Filebeat which log files to read
- Tells Filebeat which index to ship to
- Tells Filebeat where to read its config and pipeline settings
config/alerts.yml- Here, we add the configuration
exclude_lines: ["bro_engine"] - Because, we do not want this module to consume Zeek logs. That's the job of the OwlH Filebeat module
- Here, we add the configuration
ingest/pipeline.json- Tells Filebeat how to handle incoming data
/usr/share/filebeat/module/owlh/
events/manifest.yml- Tells Filebeat which log files to read
- Tells Filebeat which index to ship to
- Tells Filebeat where to read its config and pipeline settings
config/config.yml- Here, we add the configuration
exclude_lines: ["bro_engine"] - Because, we do not want this module to consume Zeek logs. That's the job of the OwlH Filebeat module
- Here, we add the configuration
ingest/pipeline.json- Tells Filebeat how to handle incoming data
Let's take a deeper look at a snippet of /usr/share/filebeat/module/owlh/events/ingest/pipeline.json
    {
      "date_index_name": {
        "field": "timestamp",
        "date_rounding": "d",
        "index_name_prefix": "{{ fields.index_prefix }}",
        "index_name_format": "yyyy.MM.dd",
        "ignore_failure": true,
        "if": "ctx.data?.bro_engine == 'CONN'"
      }
    },
    {
      "date_index_name": {
        "field": "timestamp",
        "date_rounding": "d",
        "index_name_prefix": "owlh-dns-1.x-",
        "index_name_format": "yyyy.MM.dd",
        "ignore_failure": true,
        "if": "ctx.data?.bro_engine == 'DNS'"
      }
    }
Notice the "if": "ctx.data?.bro_engine == 'TYPE'" logic here. Remember from before that we are tagging our Zeek logs with the additional "bro_engine":"TYPE" property. We do this so that Filebeat can properly ingest this data.
Out of the box, when you first setup OwlH, it is only shipping the following Zeek logs to Elasticsearch:
- Connection logs
- DNS logs
So, even if you are sending Zeek HTTP logs to Wazuh Manager, and the alerts are writing to /var/ossec/logs/alerts/alerts.json, Filebeat is reading the logs, but it's not going to ship the HTTP logs, because there's no match for it here.
How Can I Ship More Zeek Logs to Elasticsearch?
Example: weird.log
Let's say you want to send weird.log to Elasticsearch, the process for getting that into Wazuh and then into Elasticsearch is broken down like so...
OwlH Node
Log Tagging
First, you want to edit your owlh.zeek file on the NIDS node(s) and make sure the following line is present:
redef record Weird::Info += {
    bro_engine:    string    &default="WEIRD"    &log;
};
Now, that's going to add the "bro_engine":"WEIRD" field to the JSON logs. This accomplishes two things:
- Allows Wazuh to run logic on it for our OwlH ruleset
- Allows Filebeat to recognize this data and ship it to Elasticsearch
Analyzer Ingestion
Edit your Analyzer configuration and add the weird.log path to the srcfiles list. Now, the weird.log file will be ingested by the Analyzer and merged into /var/logs/owlh/alerts/alerts.json, which will be ingested by the Wazuh agent.
Be sure to restart the Analyzer service after any changes!
Wazuh Manager
Alerts
We'll use the /var/ossec/ruleset/rules/0635-owlh-zeek_rules.xml file as a template to create a custom rule file for Zeek weird alerts.
Let's create a custom rule file: /var/ossec/etc/rules/10635-owlh-zeek_rules.xml and add the following contents to it:
<group name="zeek,ids,">
  <rule id="66005" level="5">
    <field name="bro_engine">WEIRD</field>
    <description>Zeek: Weird detail</description>
  </rule>
</group>
Now, when the weird.log contents are shipped in from /var/log/owlh/alerts/alerts.json, the field "bro_engine":"WEIRD" will trip this rule and log to /var/ossec/logs/alerts/alerts.json
Restart the Wazuh Manager service
systemctl restart wazuh-managerFilebeat
We'll edit this file and add another pipeline to it: /usr/share/filebeat/module/owlh/events/ingest/pipeline.json
{
  "description": "OwlH events pipeline",
  "processors": [
    { "json" : { "field" : "message", "add_to_root": true } },
    {
      "date": {
        "field": "timestamp",
        "target_field": "@timestamp",
        "formats": ["ISO8601"],
        "ignore_failure": false
      }
    },
    {
      "date_index_name": {
        "field": "timestamp",
        "date_rounding": "d",
        "index_name_prefix": "{{ fields.index_prefix }}",
        "index_name_format": "yyyy.MM.dd",
        "ignore_failure": true,
        "if": "ctx.data?.bro_engine == 'CONN'"
      }
    },
    {
      "date_index_name": {
        "field": "timestamp",
        "date_rounding": "d",
        "index_name_prefix": "owlh-dns-1.x-",
        "index_name_format": "yyyy.MM.dd",
        "ignore_failure": true,
        "if": "ctx.data?.bro_engine == 'DNS'"
      }
    },
    {
      "date_index_name": {
        "field": "timestamp",
        "date_rounding": "d",
        "index_name_prefix": "owlh-weird-1.x-",
        "index_name_format": "yyyy.MM.dd",
        "ignore_failure": true,
        "if": "ctx.data?.bro_engine == 'WEIRD'"
      }
    }
  ]
}
Pay careful attention to the syntax here. Notice the final } after the DNS object, now has a }, and we add the WEIRD object which does not have a }, at the end of it. Syntactic errors will break JSON configurations, so be mindful here.
Restart Filebeat
systemctl restart filebeatWazuh Dashboards (Kibana)
Log into Wazuh Dashboards, and add an index, so you can read the documents from Elasticsearch. You'll notice from above, we're sending to the index: owlh-weird-1.x-
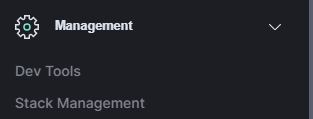
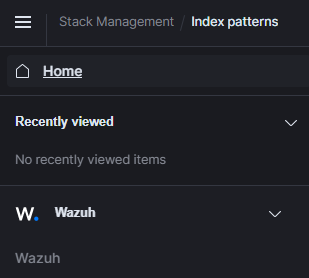
Click the menu icon in the top left
Under Management, click on Stack Management
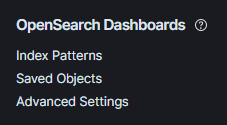
Click Index Patterns
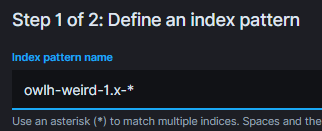
Click Create index pattern
In the box enter the following pattern: owlh-weird-1.x-* and click Next Step
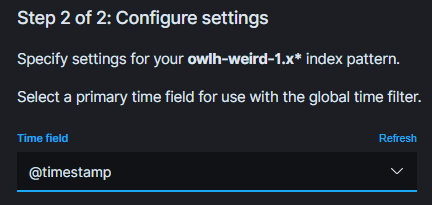
Choose @timestamp and click Create index pattern
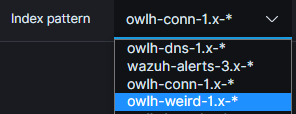
Now, click on the menu again and open Wazuh
You should now see your index pattern and if any alerts are present, should be able to view them.
Even More Logs!
For each log type, you have to know which field to append the custom tag to. Let's say we're adding the smb_files.log to be shipped to Wazuh. Then, you need to add this to the owlh.zeek file:
redef record SMB::FileInfo += {
    bro_engine:    string    &default="SMB_FILES"     &log;
};
The &default="SMB_FILES" can be whatever you wish to specify. What I'm doing here is saying, add "bro_engine": "SMB_FILES" to each event in the smb_files.log file.
But how, did we get SMB::FileInfo ? Straight from the official Zeek documentation. This will tell you the information field for each log type:
Example owlh.zeek File (click to expand)
redef record DNS::Info += {
    bro_engine:    string    &default="DNS"    &log;
};
redef record Conn::Info += {
    bro_engine:    string    &default="CONN"    &log;
};
redef record Weird::Info += {
    bro_engine:    string    &default="WEIRD"    &log;
};
redef record SSL::Info += {
    bro_engine:    string    &default="SSL"    &log;
};
redef record SSH::Info += {
    bro_engine:    string    &default="SSH"    &log;
};
redef record HTTP::Info += {
    bro_engine:    string    &default="HTTP"    &log;
};
redef record DCE_RPC::Info += {
    bro_engine:    string    &default="DCE_RPC"    &log;
};
redef record DHCP::Info += {
    bro_engine:    string    &default="DHCP"    &log;
};
redef record SMB::CmdInfo += {
    bro_engine:    string    &default="SMB_CMD"     &log;
};
redef record SMB::FileInfo += {
    bro_engine:    string    &default="SMB_FILES"     &log;
};
redef record SMB::TreeInfo += {
    bro_engine:    string    &default="SMB_MAPPING"     &log;
};
redef record NTLM::Info += {
    bro_engine:    string    &default="NTLM"    &log;
};
redef record SNMP::Info += {
    bro_engine:    string    &default="SNMP"    &log;
};
redef record SMTP::Info += {
    bro_engine:    string    &default="SMTP"    &log;
};
redef record Files::Info += {
    bro_engine:    string    &default="FILES" &log;
};
redef record Software::Info += {
    bro_engine:    string    &default="SOFTWARE"    &log;
};
redef record Notice::Info += {
    bro_engine:    string    &default="NOTICE" &log;
};
Example 10635-owlh-zeek_rules.xml File (click to expand)
This is the custom rules file on your Wazuh Manager.
<group name="zeek,ids,">
  <rule id="66005" level="5">
    <field name="bro_engine">DCE_RPC</field>
    <description>Zeek: DCE_RPC Logs</description>
  </rule>
  <rule id="66006" level="5">
    <field name="bro_engine">DHCP</field>
    <description>Zeek: DHCP Logs</description>
  </rule>
  <rule id="66007" level="5">
    <field name="bro_engine">FILES</field>
    <description>Zeek: FILES Logs</description>
  </rule>
  <rule id="66008" level="5">
    <field name="bro_engine">HTTP</field>
    <description>Zeek: HTTP Logs</description>
  </rule>
  <rule id="66009" level="5">
    <field name="bro_engine">NOTICE</field>
    <description>Zeek: NOTICE Logs</description>
  </rule>
  <rule id="66010" level="5">
    <field name="bro_engine">NTLM</field>
    <description>Zeek: NTLM Logs</description>
  </rule>
  <rule id="66011" level="5">
    <field name="bro_engine">SMB_CMD</field>
    <description>Zeek: SMB_CMD Logs</description>
  </rule>
  <rule id="66012" level="5">
    <field name="bro_engine">SMB_FILES</field>
    <description>Zeek: SMB_FILES Logs</description>
  </rule>
  <rule id="66013" level="5">
    <field name="bro_engine">SMB_MAPPING</field>
    <description>Zeek: SMB_MAPPING Logs</description>
  </rule>
  <rule id="66014" level="5">
    <field name="bro_engine">SMTP</field>
    <description>Zeek: SMTP Logs</description>
  </rule>
  <rule id="66015" level="5">
    <field name="bro_engine">SNMP</field>
    <description>Zeek: SNMP Logs</description>
  </rule>
  <rule id="66016" level="5">
    <field name="bro_engine">SOFTWARE</field>
    <description>Zeek: SOFTWARE Logs</description>
  </rule>
  <rule id="66017" level="5">
    <field name="bro_engine">WEIRD</field>
    <description>Zeek: WEIRD Logs</description>
  </rule>
</group>
Example analyzer.json File (click to expand)
Add the paths to the OwlH analyzer configuration on your OwlH NIDS node.
Run systemctl restart owlhnode after saving your changes.
    "srcfiles": [
        "/var/log/suricata/eve.json",
        "/opt/zeek/logs/current/conn.log",
        "/opt/zeek/logs/current/dns.log",
        "/opt/zeek/logs/current/weird.log",
        "/opt/zeek/logs/current/http.log",
        "/opt/zeek/logs/current/dce_rpc.log",
        "/opt/zeek/logs/current/dhcp.log",
        "/opt/zeek/logs/current/files.log",
        "/opt/zeek/logs/current/kerberos.log",
        "/opt/zeek/logs/current/smb_files.log",
        "/opt/zeek/logs/current/smb_mapping.log",
        "/opt/zeek/logs/current/smtp.log",
        "/opt/zeek/logs/current/ntlm.log",
        "/opt/zeek/logs/current/snmp.log",
        "/opt/zeek/logs/current/software.log",
        "/opt/zeek/logs/current/notice.log"
    ],
For each log you want to monitor, you'll have to follow the procedure above:
- OwlH Node
- Tag the log with the
bro_engineline - Ingest the log file with the OwlH Analyzer
- Tag the log with the
- Wazuh Manager
- Create a custom rule to match the new
bro_enginelog line - Update Filebeat to ingest the new
bro_enginelog line and log to the specified index pattern
- Create a custom rule to match the new
- Wazuh Dashboards / Kibana
- Create a new index search pattern
Addendum: Keep Logall_JSON and Alert on Zeek Only
If you're not using the logall_json option in the Wazuh Manger, you've reached the end of the blog post and should be all set.
Say for example, you've enabled logall_json , but you'd like to keep the alerts output whilst disabling the raw output. You can use a filebeat processor for that.
- Edit
/usr/share/filebeat/module/wazuh/archives/config/archives.yml - Add this processor at the bottom of the file. This will allow us to log events when the
full_logfield matches ourritacommand, but only when they are alerts generated by the custom RITA rules, which should contain aDescriptionto match on. - Again, we're doing this so that we don't duplicate data in Elasticsearch. Either alerts, or raw log data. The choice is yours.
processors:
  - drop_event:
      when:
        and:
          - has_fields: ['bro_engine']
          - not:
              regexp:
data.description: "^Zeek.*Log:.*"- Be sure to run:
systemctl restart filebeatafter saving your changes.